One-tailed hypothesis tests are useful when you have a clear idea about the direction of an effect, such as testing if a new drug performs better than the standard treatment, whether a new fabric treatment increases the durability of a textile, or if a new alloy used for aircrafts is stronger than the minimum required strength for safety reasons. Use this resource to learn how to conduct one-tailed hypothesis tests.
Testing two-sided claims
In the hypothesis tests we have looked at so far, we have looked for evidence that there has been a change in the population mean. The null and alternative hypotheses have been:
\(H_{o}:\mu_{\overline{x}}=\mu\) (the sample mean is the same as the population mean after allowing for chance variation)
=\(H_{a}:\mu_{\overline{x}}\neq\mu\) (the sample mean is not the same as the population mean after allowing for chance variation).
These tests look for a change in either direction: has the population mean increased or has the population mean decreased? They involve two-sided claims.
Non-directional tests are called two-sided (or two-tailed) tests. The two-sided approach helps you focus on detecting differences in a specific direction, providing more power to find a significant effect if it exists.
Testing one-sided claims
When claims use words like "greater", "less than", "lower", higher", "more", or similar, they are one-sided claims. They involve changes in one direction. Examples are:
Queenslanders have a greater chance of skin cancer.
The drop-out rate for Business students is lower than the university average.
Drug A is more effective than drug B.
Battery X lasts longer than \(300\) minutes.
Superannuation company Bib outperformed superannuation company Bob in \(2017\).
When we test hypotheses related to one-sided claims, we use one-sided (or one-tailed) tests.
The null and alternative hypotheses for one-tailed tests may be:
\(H_{0}:\mu_{\overline{x}}\leq\mu\) (the sample mean is not greater than the population mean after allowing for chance variation)
\(H_{a}:\mu_{\overline{x}}>\mu\) (the sample mean is greater than the population mean after allowing for chance variation)
OR
\(H_{0}:\mu_{\overline{x}}\geq\mu\) (the sample mean is not less than the population mean after allowing for chance variation)
\(H_{a}:\mu_{\overline{x}}<\mu\) (the sample mean is less than the population mean after allowing for chance variation)
Critical values
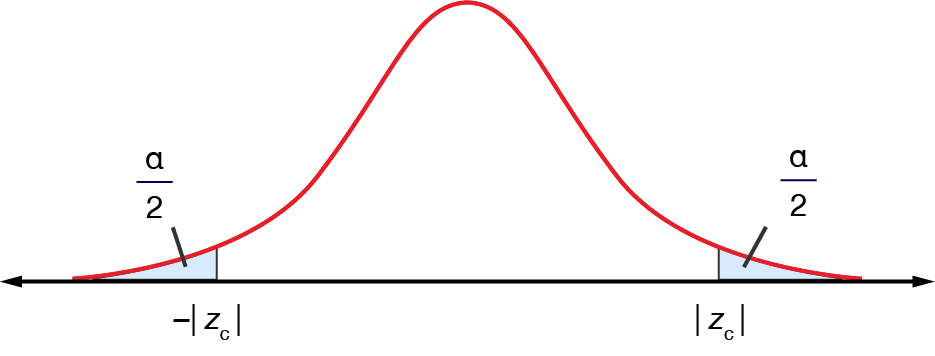
In a two-sided test with a significance level of \(\alpha\), there are two critical values and the area of each upper and lower rejection region is \(\dfrac{\alpha}{2}\).
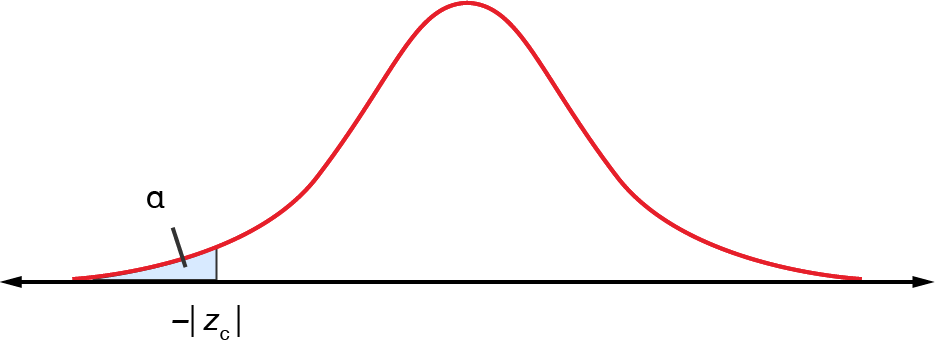
In one-sided tests with a significance level of \(\alpha\), there is only one critical value and the region of rejection with area \(\alpha\) is either on the left OR right side of the sampling distribution.
If the test statistic is greater than (or to the right of) the critical value in a one-sided test, the sample mean is greater than the claimed mean. For these claims, we use a right-tailed test.
[ll-image url="https://rmitlibrary.github.io/cdn/learninglab/illustration/subject-support/maths-and-statistics/statistics/maths_s17_right-tailed@2x.png" alt="right one sided tests" attribution-id="my-id" align="centre"]
If the test statistic is smaller than (or to the left of) the critical value in a one-sided test, the sample mean is smaller than the claimed mean. For these claims, we use a left-tailed test.
Example – conducting one-sided tests
A baking company claims that the amount of meat in its pies is at least \(50\textrm{ g}\). However, a consumer group has had many complaints and decides to conduct a test to check if the pies are being underfilled. A random sample of \(10\) pies resulted in the following data:
Is there evidence in this sample that the pies are being underfilled (\(\alpha=0.05\))?
From the data, we can calculate \(\overline{x}\) and \(s\).
\[\begin{align*} \overline{x} & = \frac{\sum{x_{n}}}{n}\\
& = \frac{477}{10}\\
& = 47.7
\end{align*}\] \[\begin{align*} s & = \sqrt{\frac{\sum(x-\overline{x})^{2}}{n-1}}\\
& = \frac{30.6}{10-1}\\
& = 3.4
\end{align*}\]
We can then state the null and alternate hypotheses.
\(H_{o}:\mu_{\overline{x}}\geq50\)
\(H_{a}:\mu_{\overline{x}}<50\)
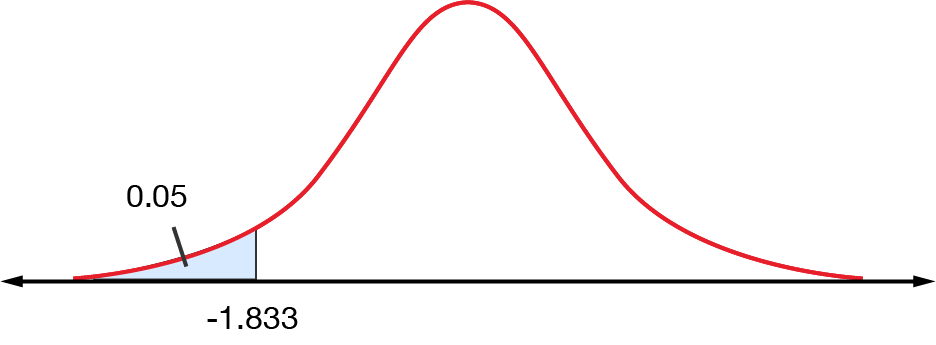
We know the significance level is \(\alpha=0.05\) and since we only have the sample standard deviation \(s\), we use a t-test. As we are dealing with a directional claim, it is a one-sided t-test. The degrees of freedom is \(n-1=10-1=9\).
From the t-table, the critical value is \(-1.833\). We need to check whether the test statistic is less than the critical value; this indicates that the sample mean is significantly smaller than the claimed mean.
Let's calculate the test statistic.
\[\begin{align*} t & = \frac{\overline{x}-\mu}{s_{\overline{x}}}\\
& = \frac{47-50}{\frac{3.4}{\sqrt{10}}}\\
& = -2.14
\end{align*}\]
The test statistic is indeed less than the critical value, so we reject the null hypothesis. There is enough evidence to suggest that the pies are being filled with less than \(50\textrm{ g}\) of meat.
Exercise – conducting one-sided tests
Nutrition guidelines for an aged care facility recommend that no more than \(71.1\textrm{ mg}\) of a particular vitamin be consumed each day. A random sample of \(7\) residents revealed \(\overline{x}=71.3\) and \(s=0.214\). Use a test with \(\alpha=0.05\) to decide if there is evidence of a problem with the dietary intake at this facility.
A long-term analysis of Rabbit University students’ study habits revealed that, on average, students study for \(18\) hours per week with a standard deviation of \(4.2\) hours. However, a random sample of \(45\) students in \(2017\) had a mean weekly study time of \(14.68\) hours. At the \(1\%\) significance level, does this data suggest that students at Rabbit University are now studying less?
An IVF process resulted in \(50\) successful live births of which \(33\) were females. Use the p-value method to decide, at the \(1\%\) level of significance, whether female children are more likely to result from this procedure.
One-sided t-test: test statistic\(=2.47\) and critical t-value\(=1.943\). There is enough evidence to suggest that there is a problem with the dietary intake at the facility, so we reject the null hypothesis.
One-sided t-test: test statistic\(=-5.30\) and critical t-value\(=-2.414\). There is enough evidence to suggest that students at Rabbit University are now studying less, so we reject the null hypothesis.
One-sided \(z\)-test: test statistic\(=2.263\) and p-value\(=0.012\). There is not enough evidence to suggest that female children are more likely from IVF, so we do not reject the null hypothesis.
One-tailed tests in context
In business, the General Insurance Company has established that it costs \(\$70.00\) on average to complete a claim, including processing the paperwork, paying the assessor and finalising the claim. When compared with the costs claimed by other insurance firms, this seems to be much more expensive.
As a result, cost-cutting measures were introduced. To evaluate the impact of these new measures, a sample of \(22\) recent claims were chosen at random and the costs were recorded. This showed that the sample mean \((\overline{x})\) was \(\$66\) and the standard deviation \((s)\) of the sample was \(\$10\).
At the at \(\alpha=0.01\) level of significance, is there a reduction in the average cost, or can the difference of \(\$4\) (\(\$66–\$70\)) be attributed to chance?
The null hypothesis is \(H_{0}:\mu=70\) and the alternative hypothesis is \(H_{a}:\mu<70\).
The test statistic is:
\[\begin{align*} t & = \frac{\overline{x}-\mu}{\frac{s}{\sqrt{n}}}\\
& = \frac{66-70}{\frac{10}{\sqrt{22}}}\\
& = -1.876
\end{align*}\]
For \(\alpha=0.01\), the interval of interest would be \(\left[-2.518,2.518\right]\). \(t=-1.876\) lies within the interval of interest, so we do not reject the null hypothesis, \(H_{0}\). In other words, the cost-cutting measures did not work, tested at the \(\alpha=0.01\).
Unless otherwise labelled, images on this page by RMIT, licensed under CC BY-NC 4.0