Mendel's pea plant experiments
Practise observing results and recording data by simulating Mendel’s pea plant experiments.
Punnett squares are vital tools for understanding how genetic traits are inherited. They provide a simple way to predict the probabilities of offspring inheriting certain traits based on the genetic makeup of the parents. This knowledge is crucial in fields like medicine, where it helps assess the risk of genetic disorders, and in agriculture, where it aids in breeding for desirable traits. Use this resource to learn how Punnett squares can simplify complex genetic predictions.
When two organisms are crossed, the produce offspring that inherit genetic information from both parents. Punnett squares are diagrams used to predict the genetic outcomes of a cross.
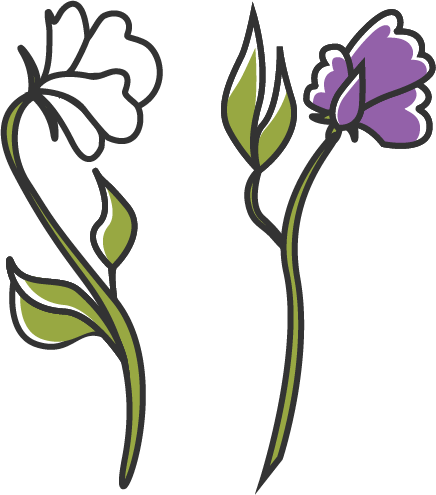
An example of a Punnett square. The genotype across the top, capital P and lower case p, represents a pea plant with purple flowers and the genotype down the side, lower case p and lower case p, represents a pea plant with white flowers.
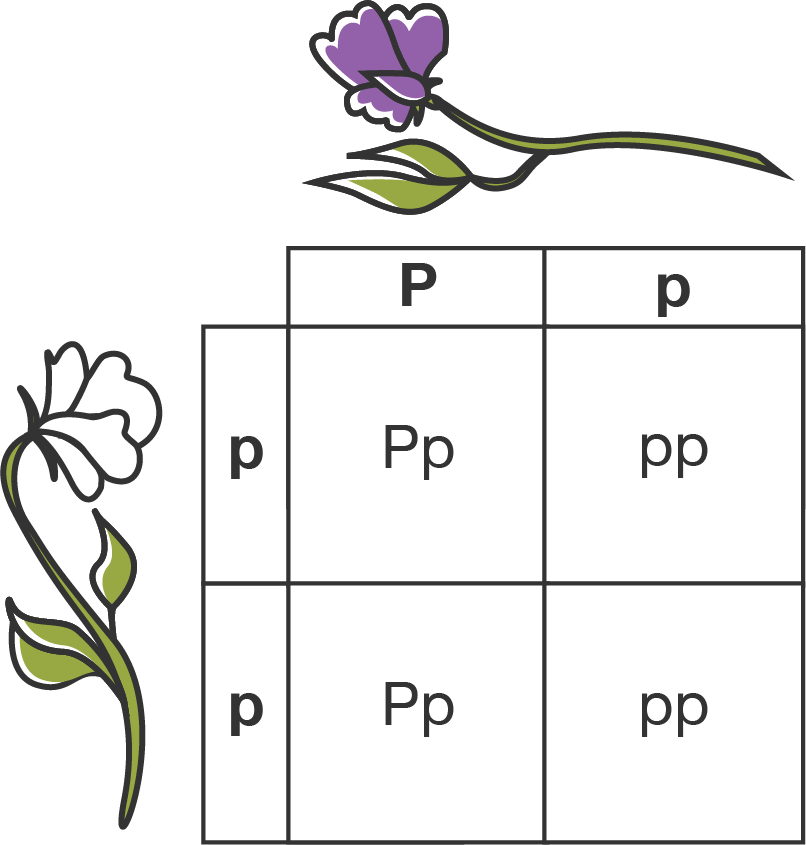
Punnett square
P
p
p
Pp
pp
p
Pp
pp
They illustrate how alleles from each parent combine, showing the possible genotypes of their offspring. Punnett squares are helpful for visualising how traits are inherited, and for understanding the probability of offspring expressing certain traits.
To set up and use a Punnett square:
One parent is heterozygous \((Pp)\) and the other is homozygous recessive \((pp)\).
The dominant allele for purple is \(P\) and the recessive allele for white is \(p\). Let's write the alleles for the heterozygous parent (\(P\) and \(p\)) across the top. We can then write the alleles for the homozygous recessive parent (\(p\) and \(p\)) down the side.
| P | p | |
|---|---|---|
| p | Pp | pp |
| p | Pp | pp |
| P | p | |
|---|---|---|
| p | ||
| p |
The genotypes are \(Pp\) and \(pp\). The phenotypes are purple \((Pp)\) and white \((pp)\). The ratios for the genotypes are \(2\,Pp:2\,pp\) or \(1:1\). The ratios for the phenotypes are \(2\) purple : \(2\) white or \(1:1\).
This means that \(50\%\) of the offspring will have purple flowers and \(50\%\) will have white flowers.
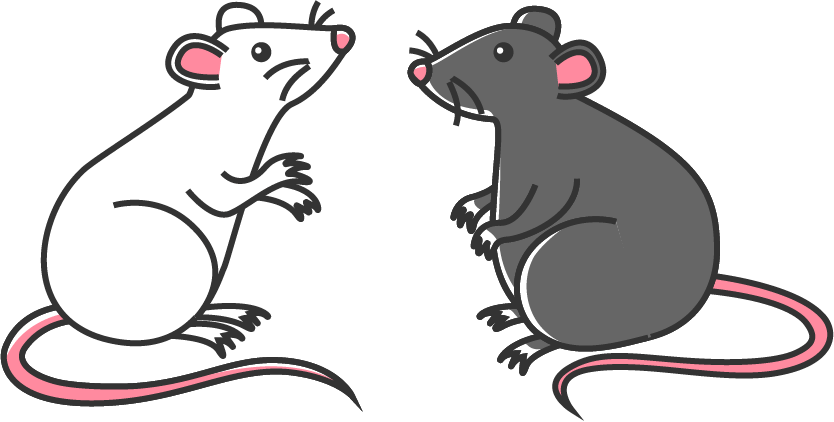
| B | b | |
|---|---|---|
| b | Bb | bb |
| b | Bb | bb |
The ratio for the genotypes is \(2\,Bb:2\,bb\). The ratio for the phenotypes is \(2\) black fur : \(2\) white fur. This means that \(50\%\) of the offspring will have black fur and \(50\%\) will have white fur.
| T | T | |
|---|---|---|
| T | TT | TT |
| t | Tt | Tt |
The ratio for the genotypes is \(2\,TT:2\,Tt\). There is only one phenotype: tall stems. This means that \(100\%\) of the offspring will have a tall stem.
| R | r | |
|---|---|---|
| R | RR | Rr |
| r | Rr | rr |
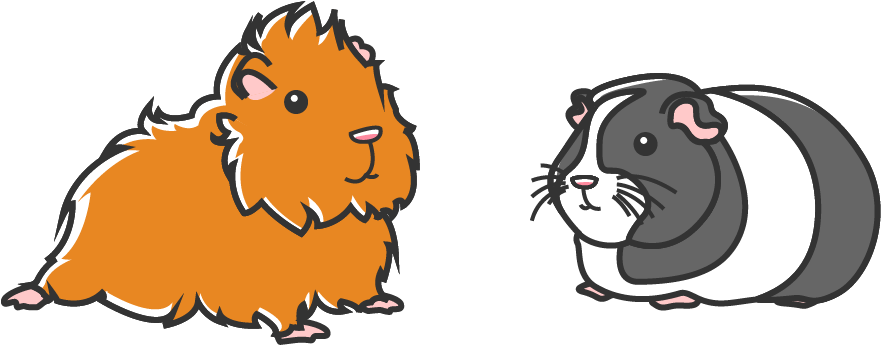
The ratio for the genotypes is \(1\,RR:2\,Rr:1\,rr\). The ratio for the phenotypes is \(3\) rough coat : \(1\) smooth coat. This means that \(75\%\) of the offspring will have a rough coat and \(25\%\) will have a smooth coat.
| C | C | |
|---|---|---|
| c | Cc | Cc |
| c | Cc | Cc |
There is only one genotype: \(Cc\). There is only one phenotype: cleft chin. This means that \(100\%\) of te offspring will have a cleft chin.
Read the scenario and use the information provided to answer the questions in the quiz.
Lisa, a genetics researcher, is investigating the distribution of a particular trait in a local bird population. She focuses on the trait controlled by a single gene with two alleles: A (dominant) and a (recessive). The possible genotypes are AA, Aa, and aa.
Lisa collected data on the genotype frequencies within the population to better understand how genetic diversity influences trait prevalence. This is shown in the pie chart.
A pie chart the percentage of different genotypes within a population. The genotypes are AA (homozygous dominant), Aa (heterozygous) and aa (homozygous recessive).
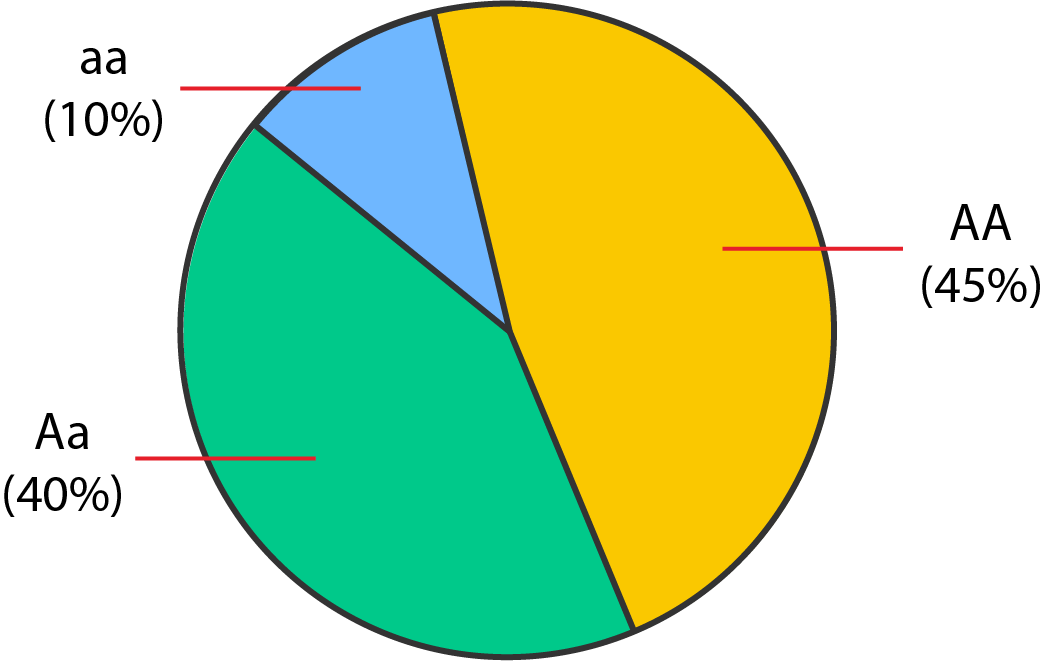
A pie chart showing genotype frequencies
Genotype
Frequency
AA (homozygous dominant)
\(45\%\)
Aa (heterozygous)
\(40\%\)
aa (homozygous recessive)
\(10\%\)
Images on this page by RMIT, licensed under CC BY-NC 4.0


RMIT University acknowledges the people of the Woi wurrung and Boon wurrung language groups of the eastern Kulin Nation on whose unceded lands we conduct the business of the University. RMIT University respectfully acknowledges their Ancestors and Elders, past and present. RMIT also acknowledges the Traditional Custodians and their Ancestors of the lands and waters across Australia where we conduct our business - Artwork 'Sentient' by Hollie Johnson, Gunaikurnai and Monero Ngarigo.
More information