To find probabilities in normal distributions that aren't standard, we need to adjust the data to a common scale using \(z\)-scores. This allows us to find the likelihood of certain outcomes in a range of contexts, like identifying manufacturing tolerances, testing the tensile strength of new materials or calculating the probability of electronic failure. Use this resource to learn how!
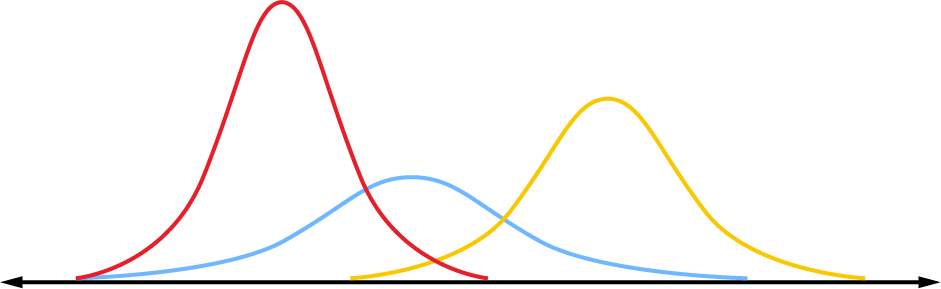
Even when data follows a normal distribution, different data sets will have their own mean and standard deviation and a different bell shaped curve. More often than not, they do not follow the standard normal distribution.
For any normal distribution, the mean and standard deviation can be used to convert it to a standard normal distribution. We can then find probabilities using a \(z\)-table.
Every score in a normally distributed dataset, regardless of the shape, has an equivalent score in the standard distribution.
The mean of the normal distribution would be standardised to \(0\).
One standard deviation from the mean \(\mu\pm\sigma\) would shift to \(\pm1\).
Two standard deviations from the mean \(\mu\pm2\sigma\) would shift to \(\pm2\).
Three standard deviations from the mean \(\mu\pm3\sigma\) would shift to \(\pm3\).
Converting \(z\)-scores
For \(z\)-scores aside from the mean and standard deviation, we can use a formula:
\[z = \dfrac{x-\mu}{\sigma}\]
Remember that the \(z\)-score is the number of standard deviations away from the mean.
Example – converting \(z\)-scores
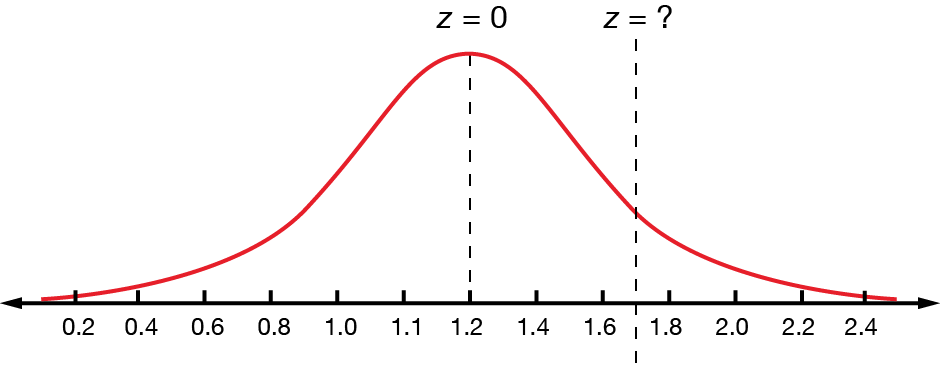
If we have a normal distribution with a mean of \(1.2\) and a standard deviation of \(0.4\), find the standardised score for \(x=1.7\).
\[\begin{align*} z & = \frac{(x-\mu)}{\sigma}\\
& = \frac{(1.7-1.2)}{0.4}\\
& = 1.25
\end{align*}\]
A score of \(1.7\) in the distribution with mean \(1.2\) and standard deviation \(0.4\) is equivalent to a standardised score of \(1.25\). Alternatively, we could say that the score \(1.7\) is \(1.25\) standard deviations above the mean for that distribution.
Calculating probabilities using \(z\)-scores
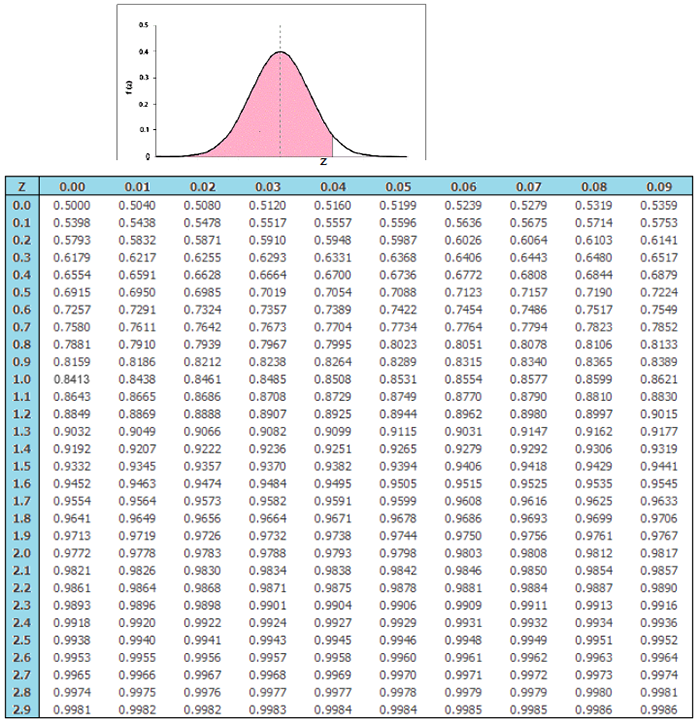
Once we have converted the scores of our distribution into standard scores or \(z\)-scores, we can use \(z\)-tables to calculate precise percentages and probabilities.
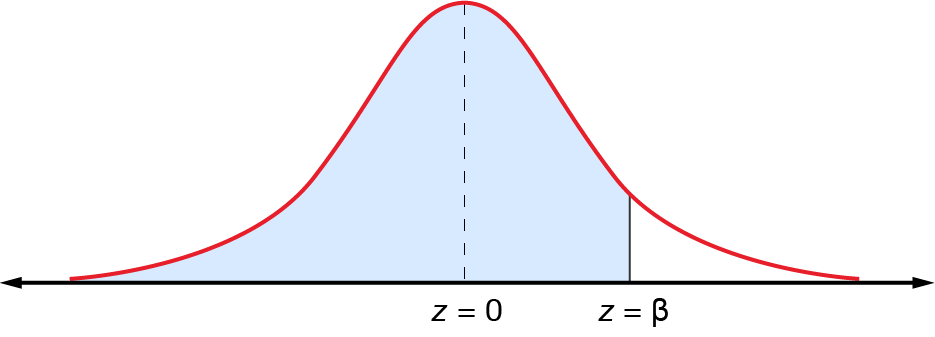
Remember that the probability is the area under the curve. Because the total area under the standardised curve is \(1\), \(\Pr(z<\beta)\) is the area to the left of \(\beta\).
As the normal distribution is a continuous distribution, we can find the probability that \(x\) is greater than or less than a particular value, but not that \(x\) is equal to a particular value.
Example 1 – calculating probabilities using \(z\)-scores
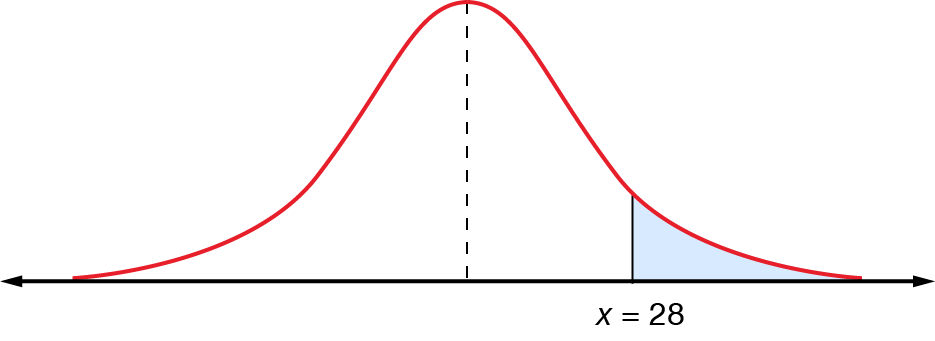
If the mean maximum temperature for Melbourne in January is \(25.9^{\circ}\textrm{C}\) with a standard deviation of \(2.1^{\circ}\textrm{C}\), what is the probability that the mean maximum temperature for January \(2015\) will be above \(28^{\circ}\textrm{C}\)?
Always start with a diagram.
The \(x\) value on interest is \(28\), so we can go ahead and convert it.
\[\begin{align*} z & = \frac{(x-\mu)}{\sigma}\\
& = \frac{(28-25.9)}{2.1}\\
& = 1
\end{align*}\]
This means that \(\Pr(x>28)\) for the normal distribution is equivalent to \(\Pr(z>1)\) on the standard normal distribution curve.
\[\begin{align*} \Pr(x>28) & = \Pr(z>1)\\
& = 1-\Pr(z<1)\\
& = 1-0.8413\\
& = 0.1587
\end{align*}\]
The probability that the mean maximum temperature for January \(2015\) will be above \(28^{\circ}\textrm{C}\) is \(0.1587\).
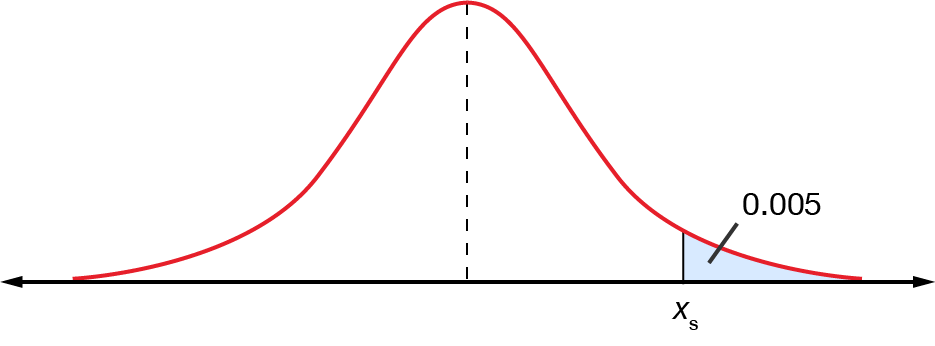
The top \(0.5\%\) of students applying for a university are given full scholarships. If the mean score on the entrance exam is \(372\) and the standard deviation is \(40\), what mark is needed to obtain a scholarship?
First, draw a diagram.
The area to the right of \(x_{s}=0.005\). We want to find \(x_{s}\).
We know that \(\Pr(x>x_{s})=0.005\) but we must first find the corresponding \(z\)-score. Let’s call it \(z_{s}\). This would mean:
\[\Pr(z>z_{s})=0.005\]
Remember that \(z\)-tables give areas from the left side of the \(z\)-score. The corresponding \(z\)-score would therefore be:
\[\begin{align*} \Pr(z<z_{s}) & = 1-0.005\\
& = 0.9950
\end{align*}\]
All we need to do is find \(0.9950\) in the \(z\)-table to find the corresponding \(z\)-score. We find that the \(z\)-score can be \(2.57\) or \(2.58\). If the \(z\)-score is between two values, we can take the average of them to find the final \(z_{s}\).
\[\frac{2.57+2.58}{2} = 2.575\]
The answer is \(2.575\), but usually, two decimal places is sufficient, so this makes \(z_{s}=2.58\).
Now, we can use the formula to find \(x_{s}\).
\[\begin{align*} z_{s} & = \frac{x_{s}-\mu}{\sigma}\\
2.58 & = \frac{x_{s}-372}{40}\\
x_{s} & = 2.58\times40+372\\
& = 475.2
\end{align*}\]
This means that applicants who score more than \(475.2\) will get a scholarship.
Exercise – calculating probabilities using \(z\)-scores
Use the following \(z\)-table to answer the questions.
If a population has a mean IQ of \(100\) and a standard deviation of \(15\), find the probability that an individual chosen at random will have an IQ:
between \(110\) and \(130\)
greater than \(87\).
A coffee machine is regulated to deliver \(200\textrm{ mL}\) per cup. In reality, the amount of coffee varies, following a normal distribution with a mean of \(200\textrm{ mL}\) and a standard deviation of \(10\textrm{ mL}\). What is the probability that a cup will contain:
less than \(195\textrm{ mL}\)?
more than \(220\textrm{ mL}\)?
between \(195\) and \(215\textrm{ mL}\)?
The heights of a group of men follow a normal distribution with a mean of \(180\textrm{ cm}\) and a standard deviation of \(6\textrm{ cm}\).
What is the probability that a man chosen from this group is less than \(185\textrm{ cm}\) tall?
If the tallest \(10\%\) of this group are automatically eligible for a basketball team, what is the qualifying height?
\(0.2286\)
\(0.8069\)
\(0.3085\)
\(0.0228\)
\(0.6247\)
\(0.7977\)
\(187.68\textrm{ cm}\)
Probability and the normal distribution in context
In design, a manufacturing company produces steel rods for a construction project. The rods are designed to have a length of \(50\textrm{ cm}\). However, due to minor variations in the production process, the actual length of the rods is normally distributed with a mean of \(50\textrm{ cm}\) and a standard deviation of \(0.5\textrm{ cm}\). What is the probability that a randomly selected steel rod will have a length greater than \(51\textrm{ cm}\).
\(\Pr(x>51)\) for the normal distribution is equivalent to \(\Pr(z>2)\) on the standard normal distribution curve.
\[\begin{align*} \Pr(x>51) & = \Pr(z>2)\\
& = 1-\Pr(z<2)\\
& = 1-0.9772\\
& = 0.0228
\end{align*}\]
The probability that a randomly selected steel rod will have a length greater than \(51\textrm{ cm}\) is \(0.0228\).