Circular functions produce periodic wave-like graphs and are foundational in trigonometry. They have broad applications across physics, engineering, and signal processing, where modelling repetitive phenomena and wave patterns is essential. Use this resource to explore circular functions.
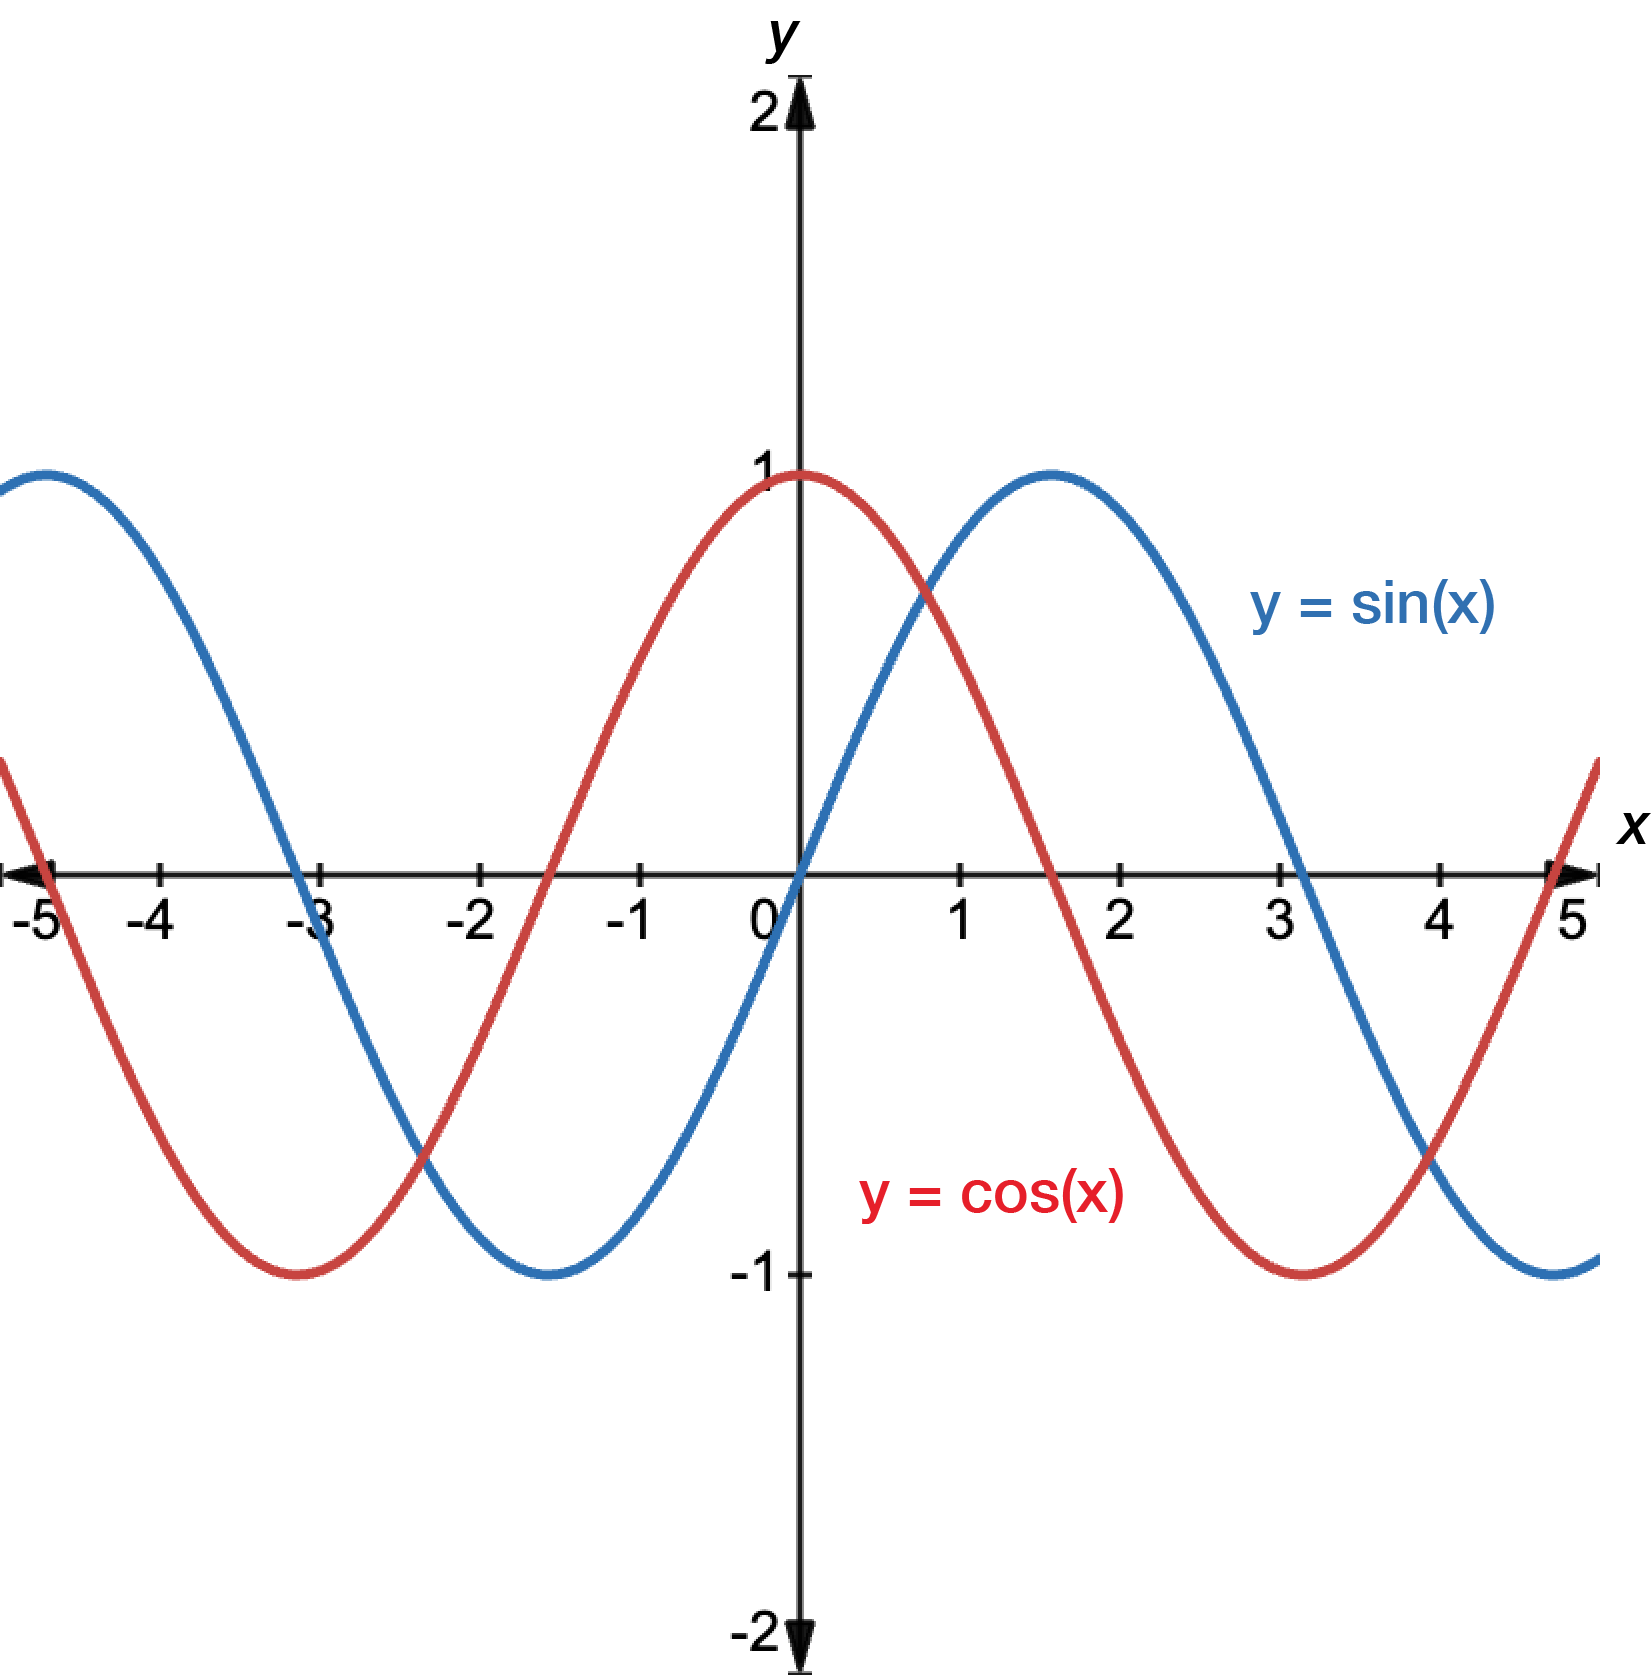
Circular functions include sine, cosine, and tangent. They describe relationships involving angles and lengths in circles.
Here, we will just look at sine and cosine functions, and their graphs.
These functions have the general forms:
\[y=a\sin(n(x-\phi))+k\] \[y=a\cos(n(x-\phi)+k\]
You will learn what \(n\), \(k\) and \(\phi\) are when we discuss transformations.
Graphs of circular functions
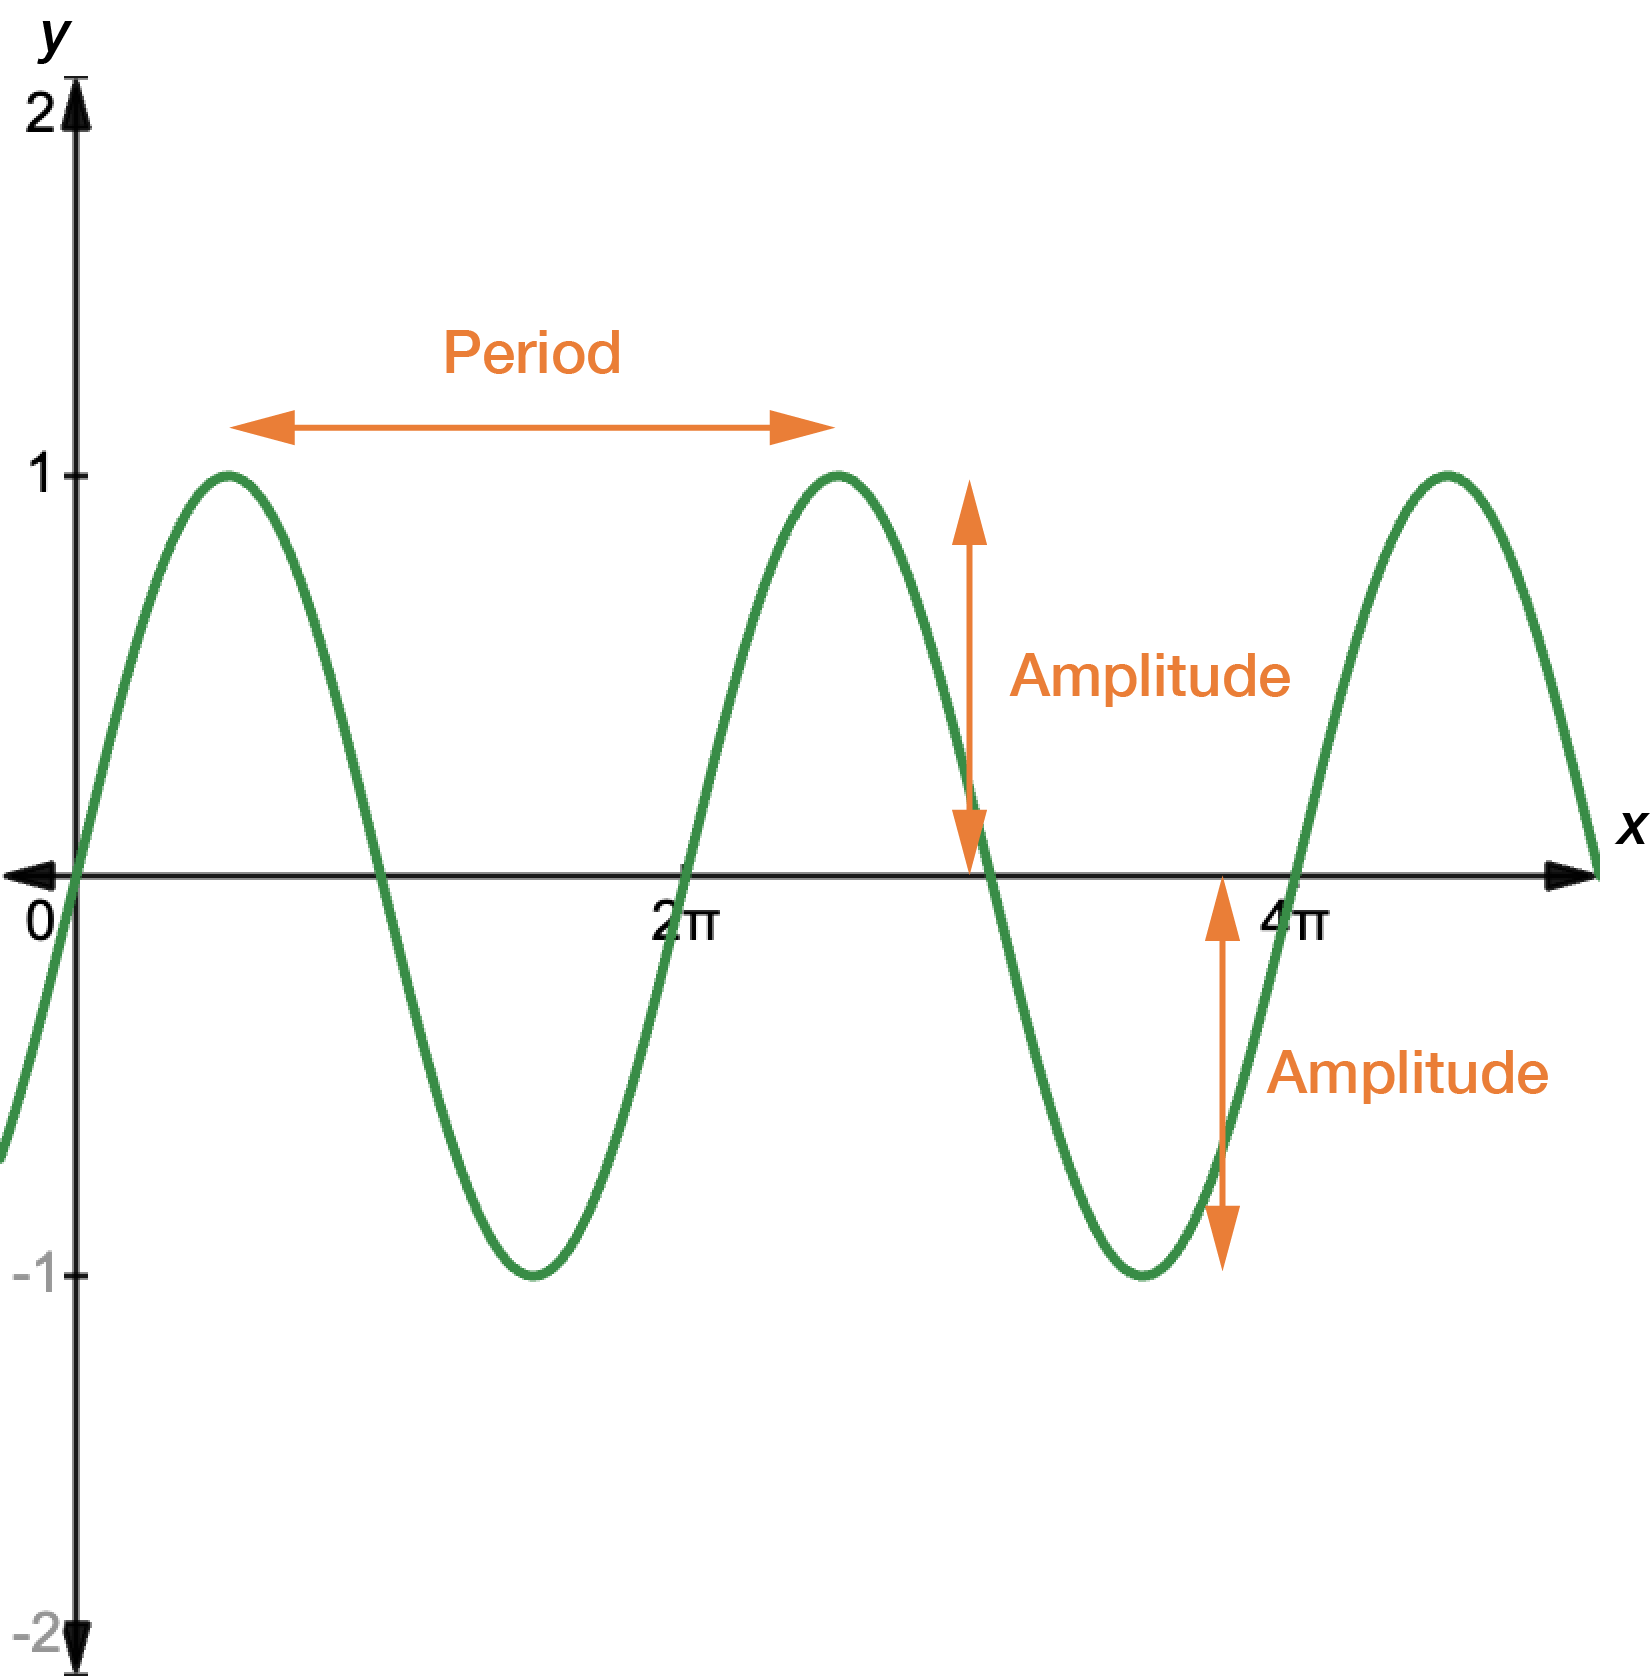
Graphs of circular functions are unique because they involve a repeating waves—that is, they are periodic. They are characterised by two key features:
amplitude which is the height from the midline of the graph to the peak of the wave (or how tall a wave is)
period which is the length of one complete cycle of the wave (or how frequently the wave repeats).
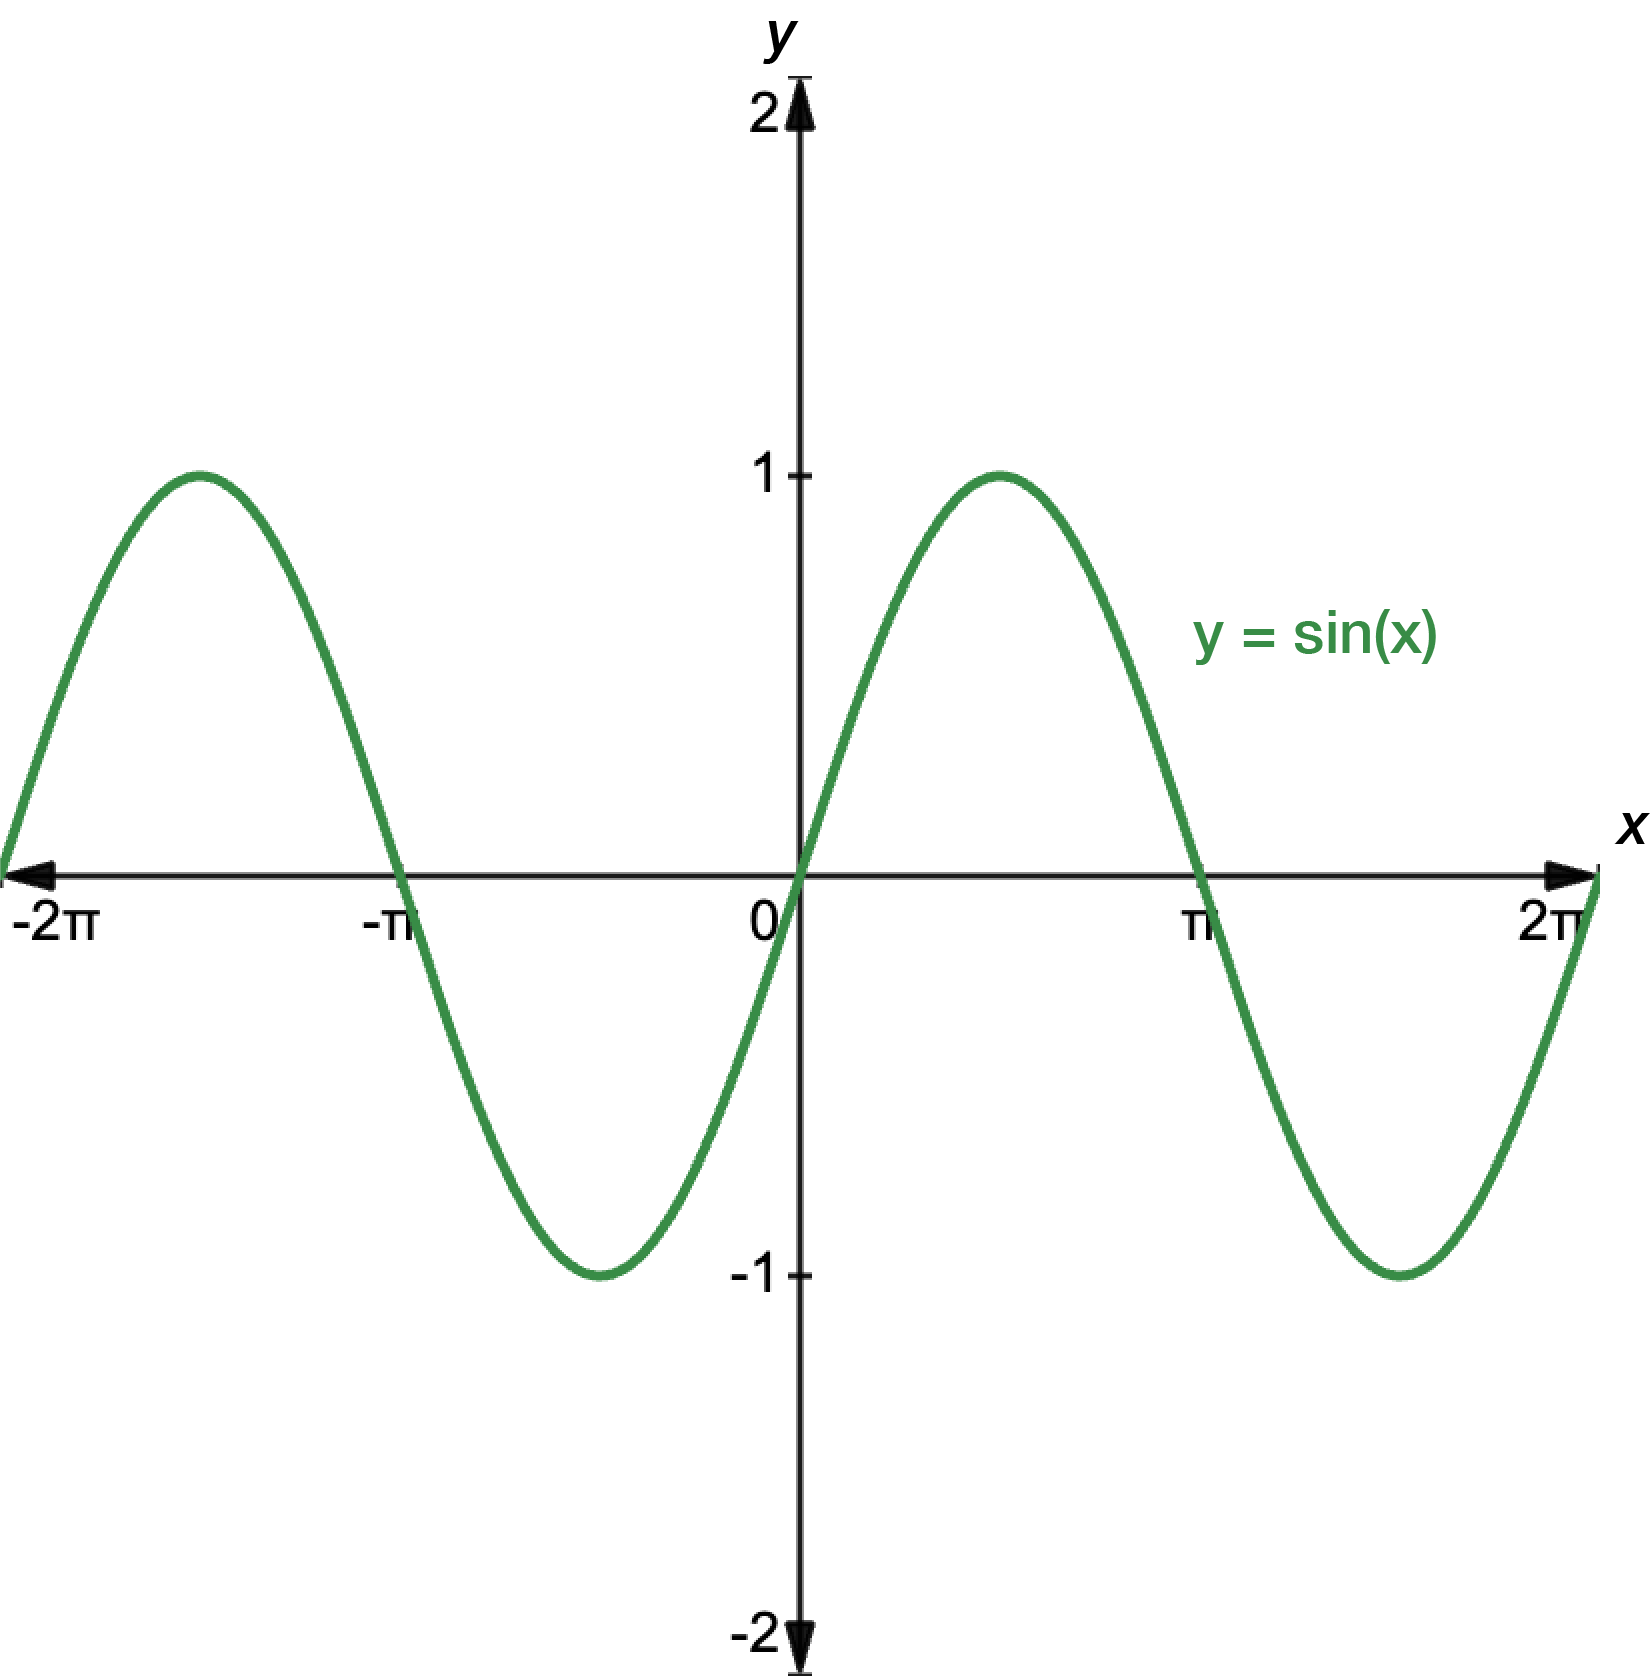
Here is the graph of \(y=\sin(x)\). It intercepts the \(y\)-axis at the origin \((0,0)\), has an amplitude of \(1\) and a period of \(2\pi\).
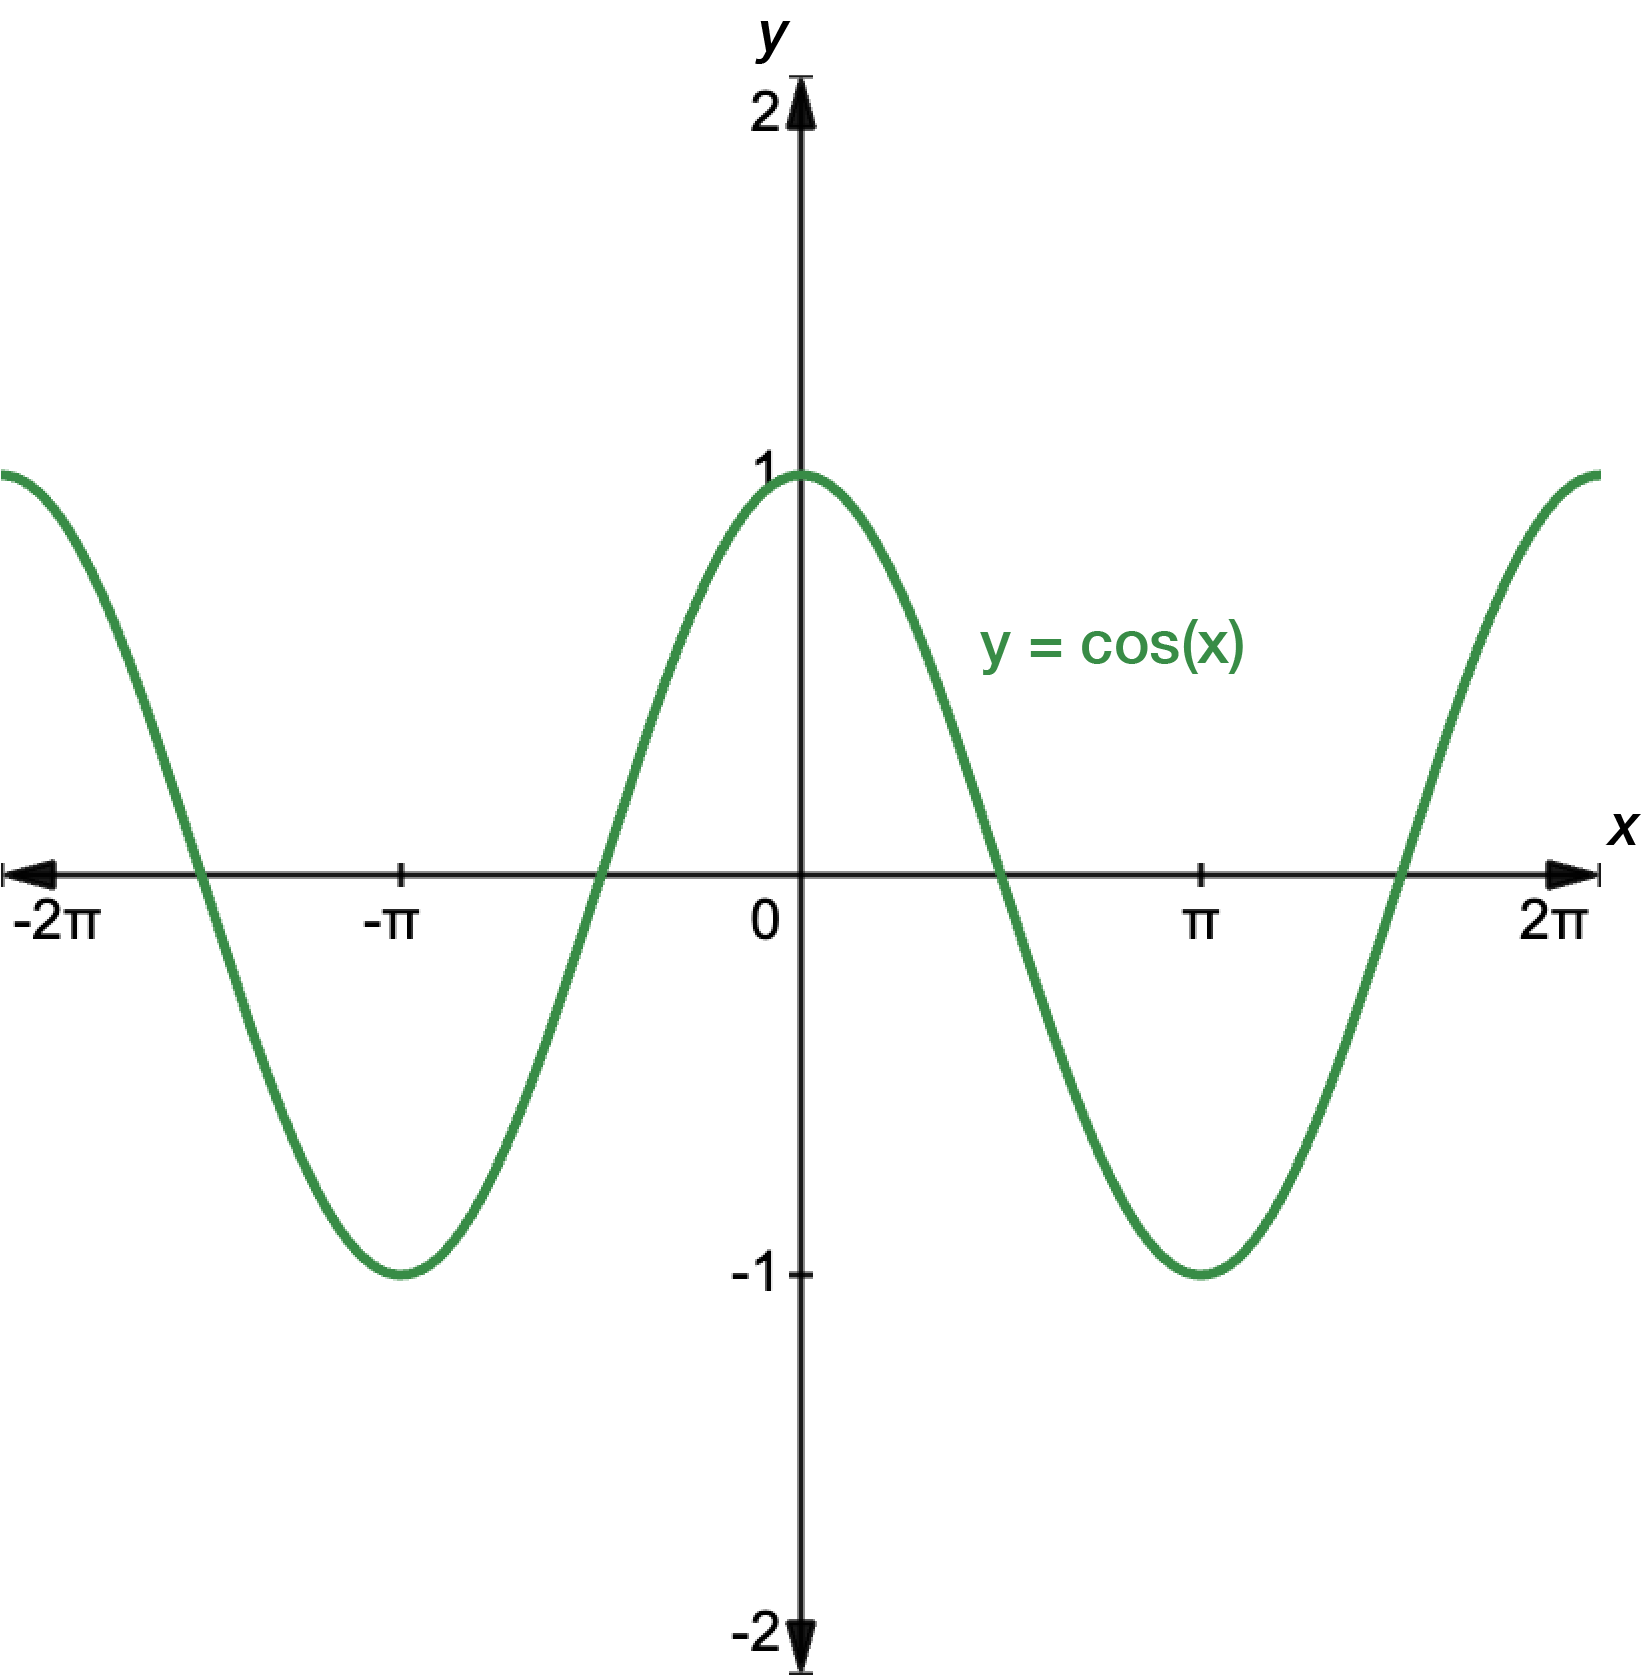
And here is the graph of \(y=\cos(x)\). It intercepts the \(y\)-axis at \((0,1)\), has an amplitude of \(1\) and a period of \(2\pi\).
Both functions have a domain of \(\mathbb{R}\) and a range of \([-1,1]\).
When looking at the graphs, remember \(\pi\approx3.142\), so \(2\pi\approx6.284\).
Transforming graphs of circular functions
When we have a graph of function \(y=a\sin(nx)\) or \(y=a\cos(nx)\):
amplitude is \(\left|a\right|\)
period is \(\dfrac{2\pi}{n}\).
We can transform circular functions just as we do with other graphs. Go back to Graphs and transformations if you need a refresher.
Vertical translation
Remember that a translation is a shift of the whole graph up, down, to the left or right.
Applying a vertical translation gives us the forms \(y=a\sin(nx)+k\) and \(y=a\cos(nx)+k\), where \(k\) is the number of units the graph is shifted. If \(k\) is positive, the graph is shifted up \(k\) units. If \(k\) is negative, the graph is shifted down \(k\) units.
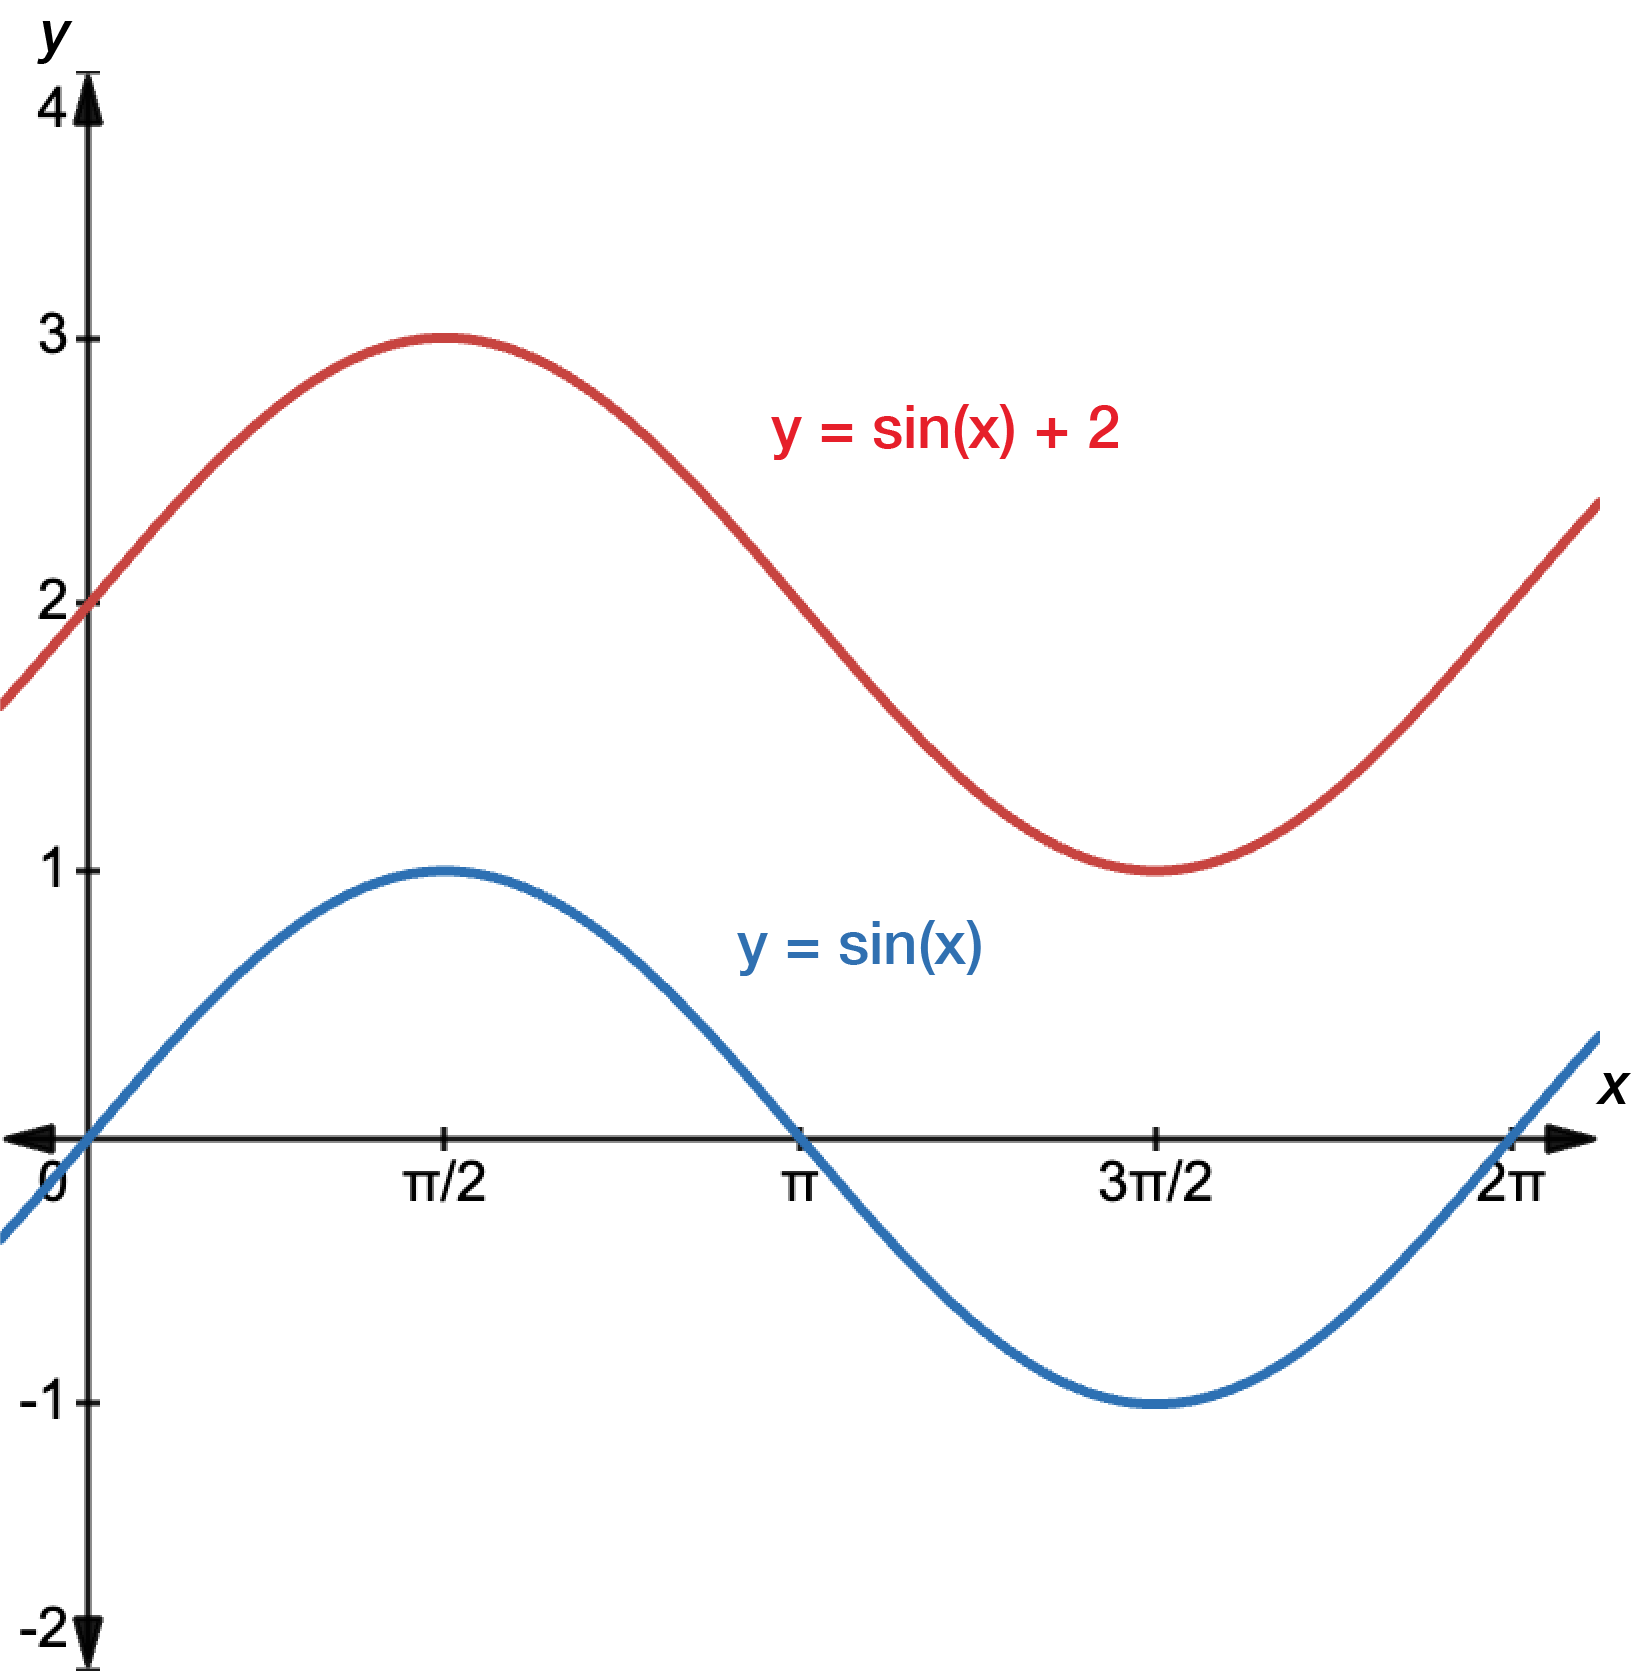
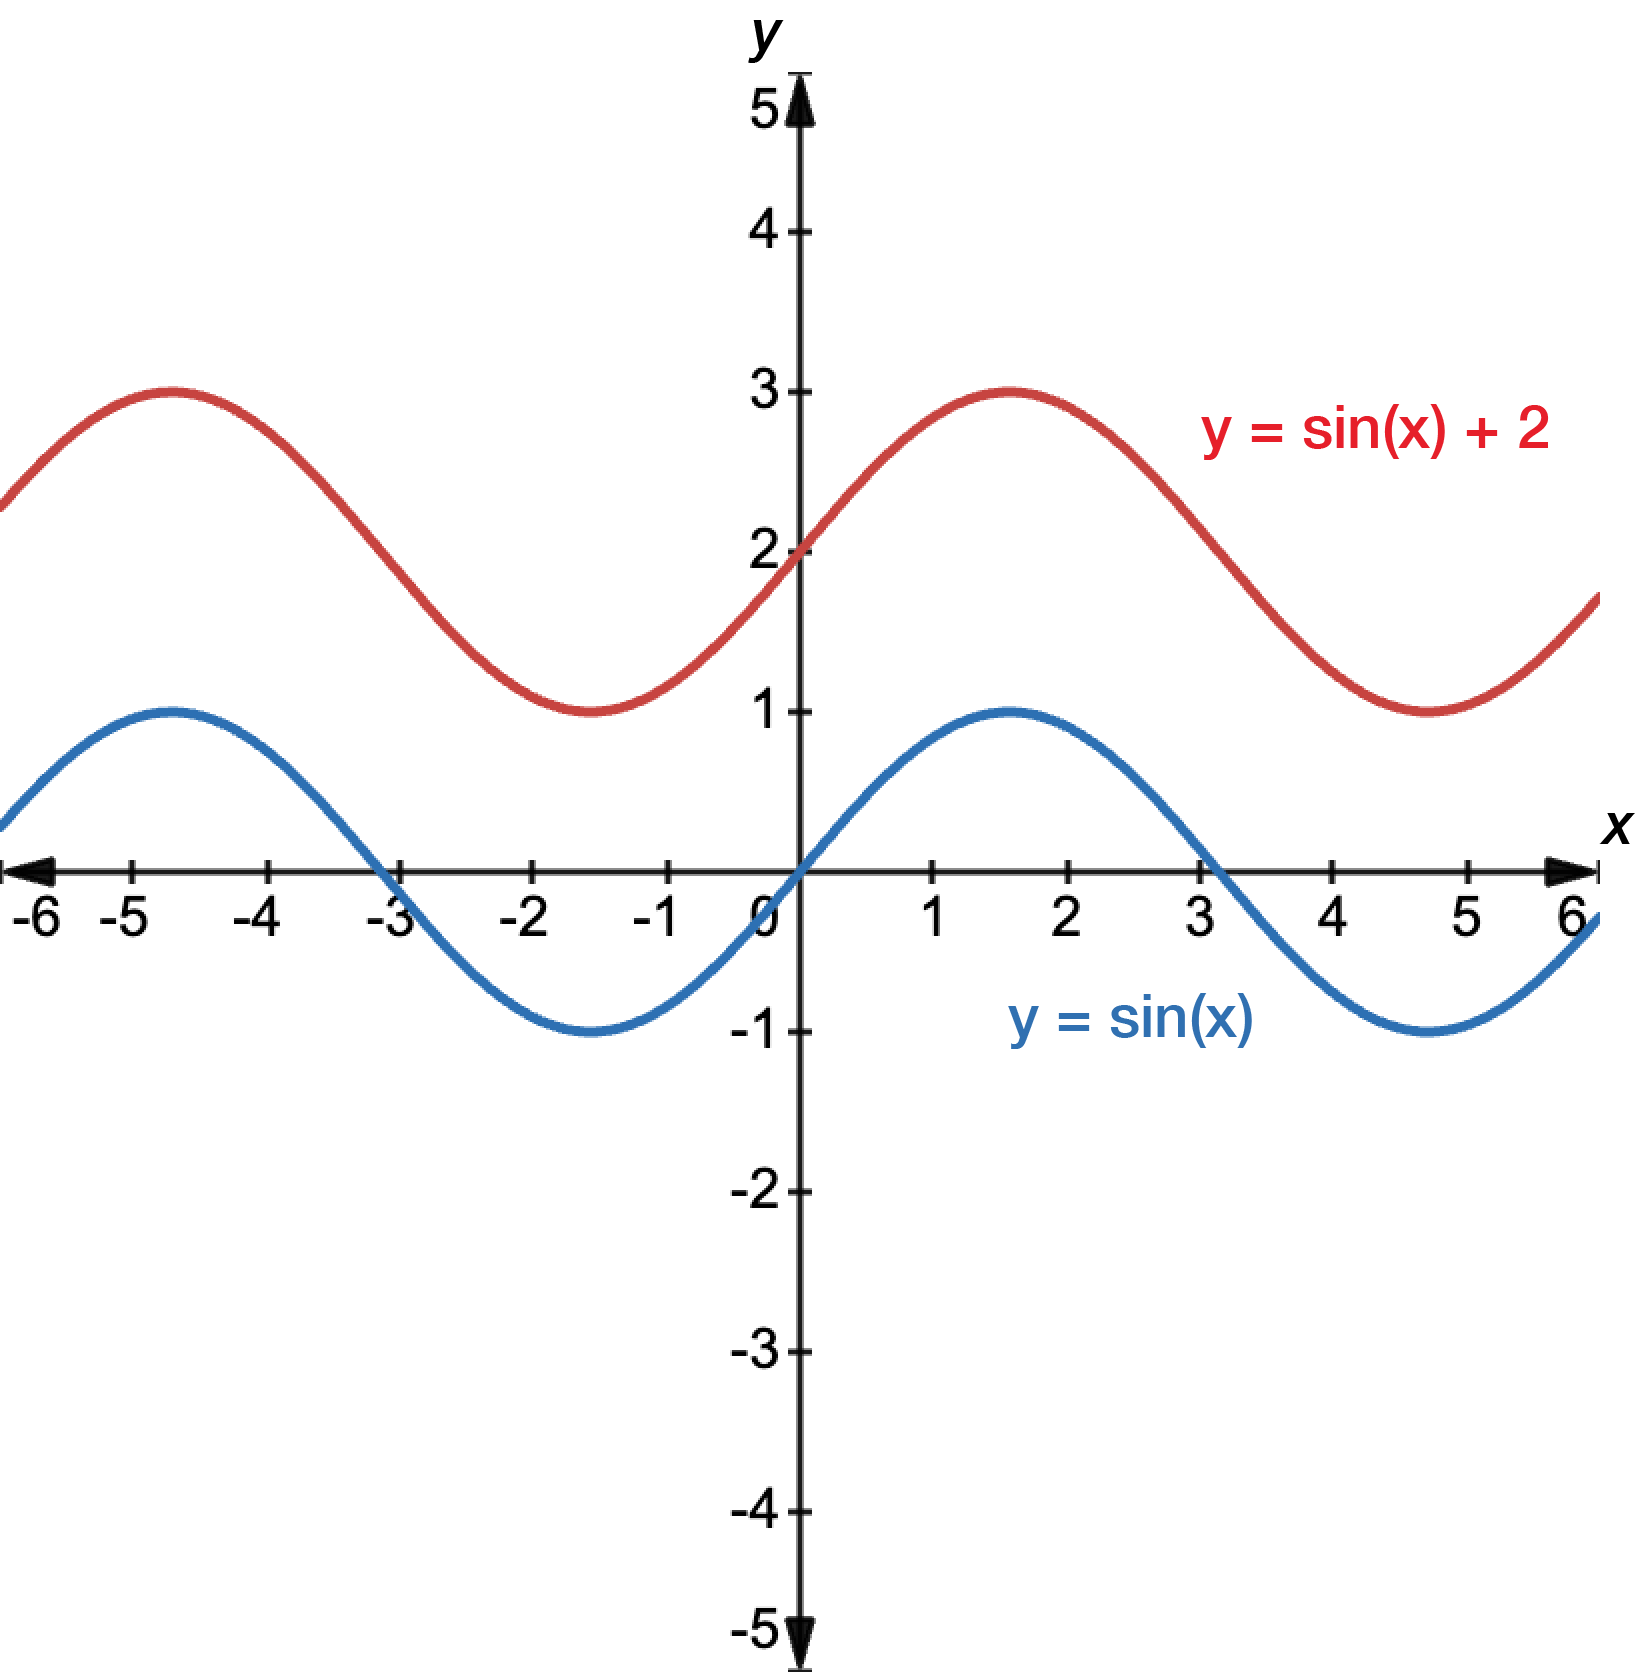
For example, consider the graphs of \(y=\sin(x)+2\) in red and \(y=\sin(x)\) in blue. \(k=2\), so the \(y=sin(x)\) graph is shifted \(2\) units up so that it intercepts the \(y\)-axis at \((0,2)\).
Horizontal translation
Replacing the \(x\) with \((x-\phi)\) shifts the graphs of \(y=\sin(x)\) and \(y=\cos(x)\) horizontally \(\phi\) units to the right.
Replacing the \(x\) with \((x+\phi)\) shifts the graphs of \(y=\sin(x)\) and \(y=\cos(x)\) horizontally \(\phi\) units to the left.
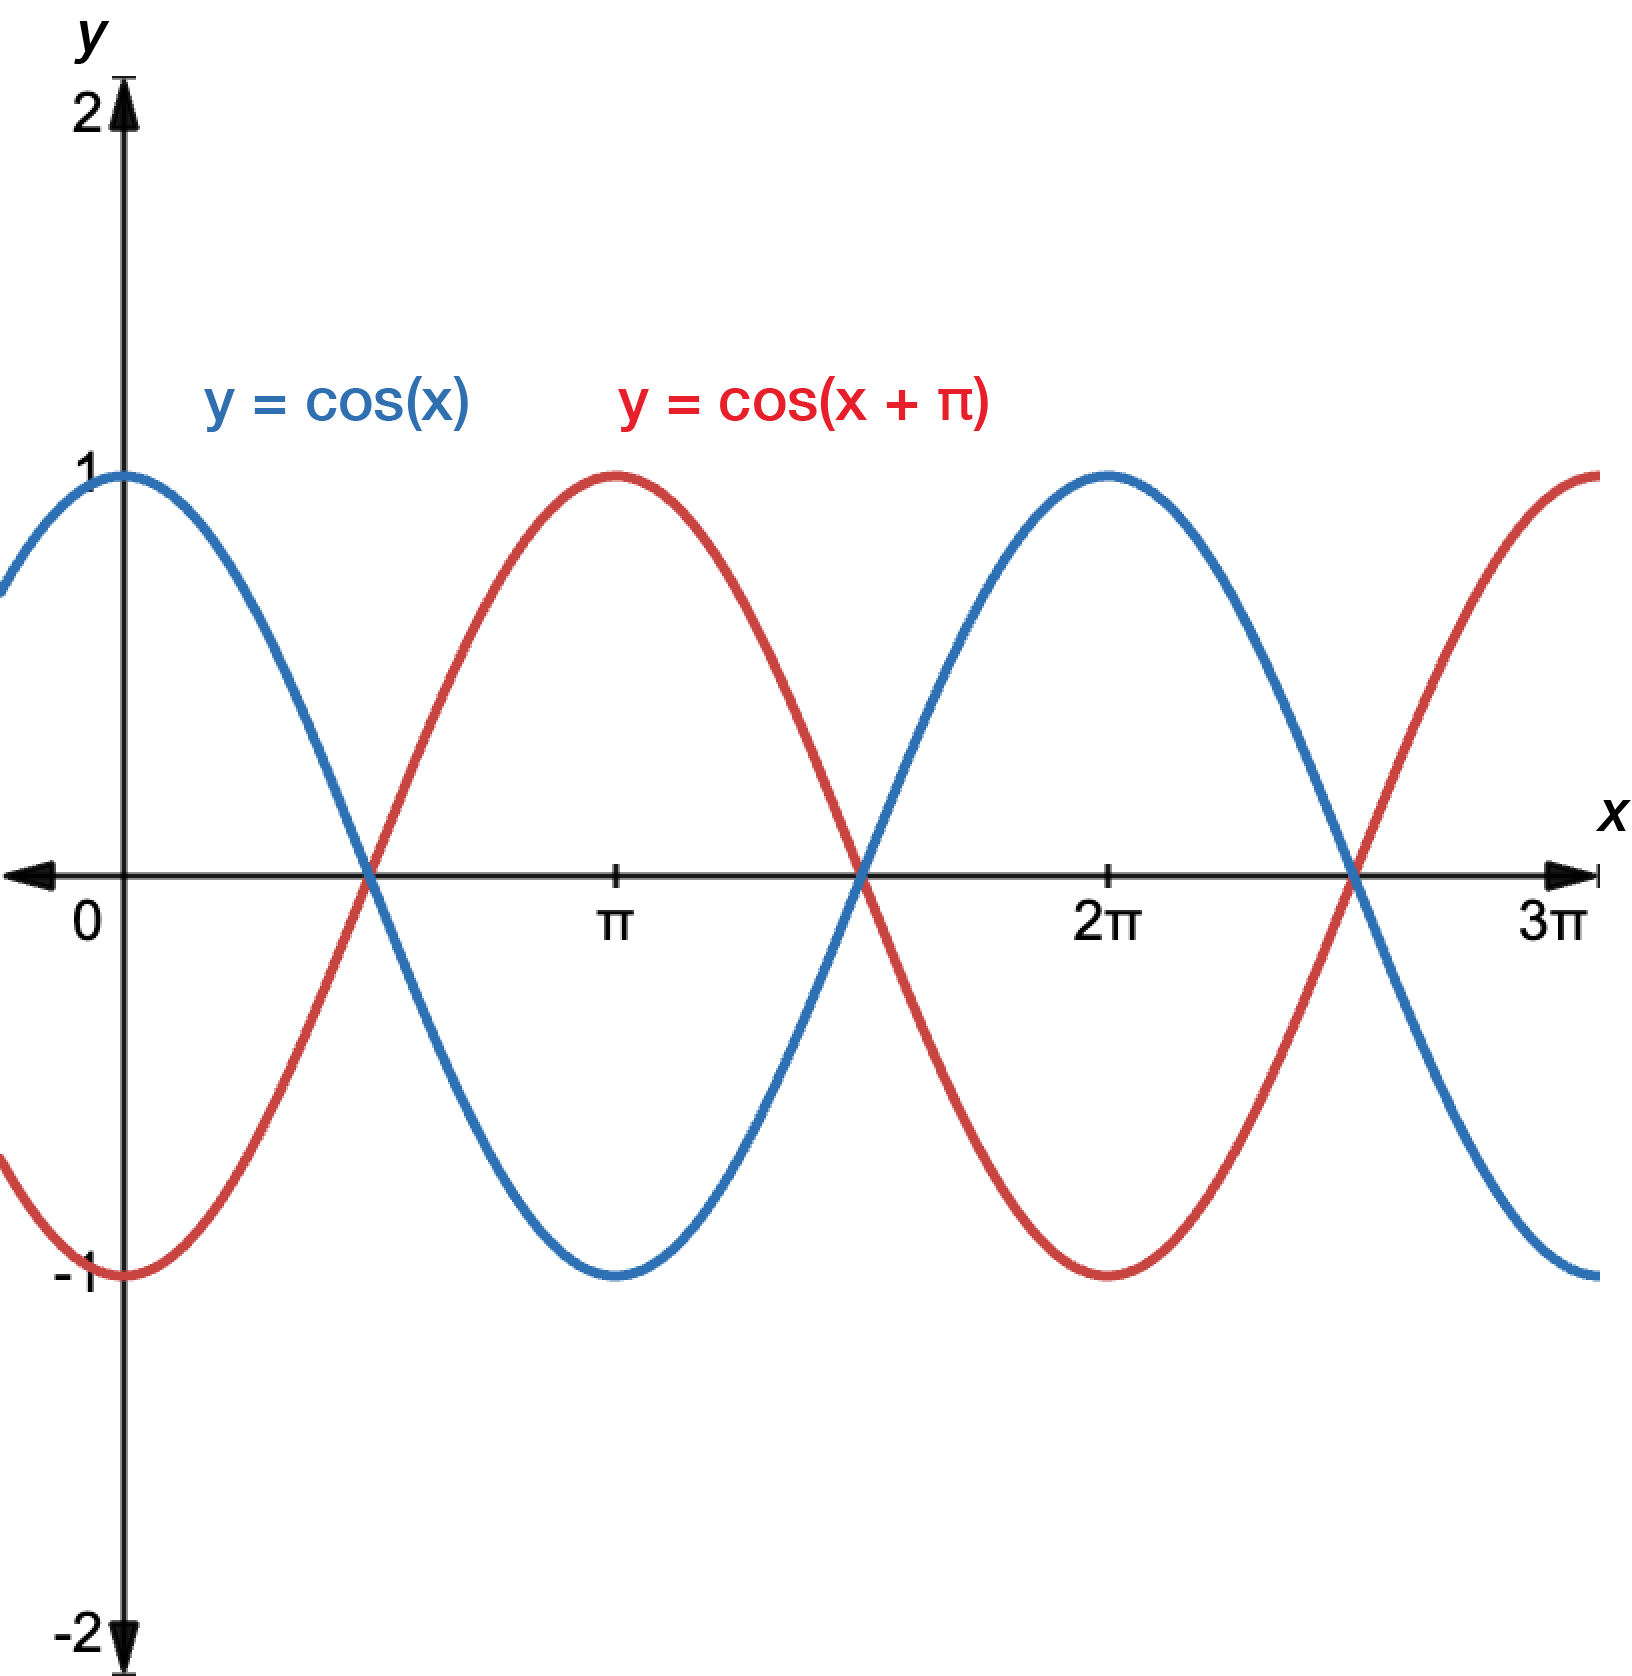
Consider the graph of \(y=\cos(x+\pi)\) in red and \(y=\cos(x)\) in blue. \(\phi=-\pi\), so the \(y=\cos(x)\) graph is shifted \(\pi\) units to the left. The new graph has a \(y\)-intercept of \(-1\).
Dilation
A graph dilates when we change the \(n\) factor for \(y=a\sin(nx)\) and \(y=a\cos(nx)\). When \(n>1\), the graph is squashed by a factor of \(n\). When \(0<n<1\), the graph is stretched by a factor of \(\dfrac{1}{n}\).
Consider the graph of \(y=\sin(x)\) in blue and \(y=\sin(2x)\) in red as examples. \(y=\sin(x)\) has a period of \(2\pi\). \(y=\sin(2x)\) has a period of \(\dfrac{2\pi}{n}=\dfrac{2\pi}{2}=\pi\).
This means that we squash \(y=\sin(x)\) by a factor of \(2\) parallel to the \(x\)-axis. The dilated graph has a period that is half that of the original graph.
Reflection
Changing the sign of \(a\) in the equations \(y=a\sin(nx)\) and \(y=a\cos(nx)\) results in reflection about the \(x\)-axis.
Example 1 – graphing circular functions
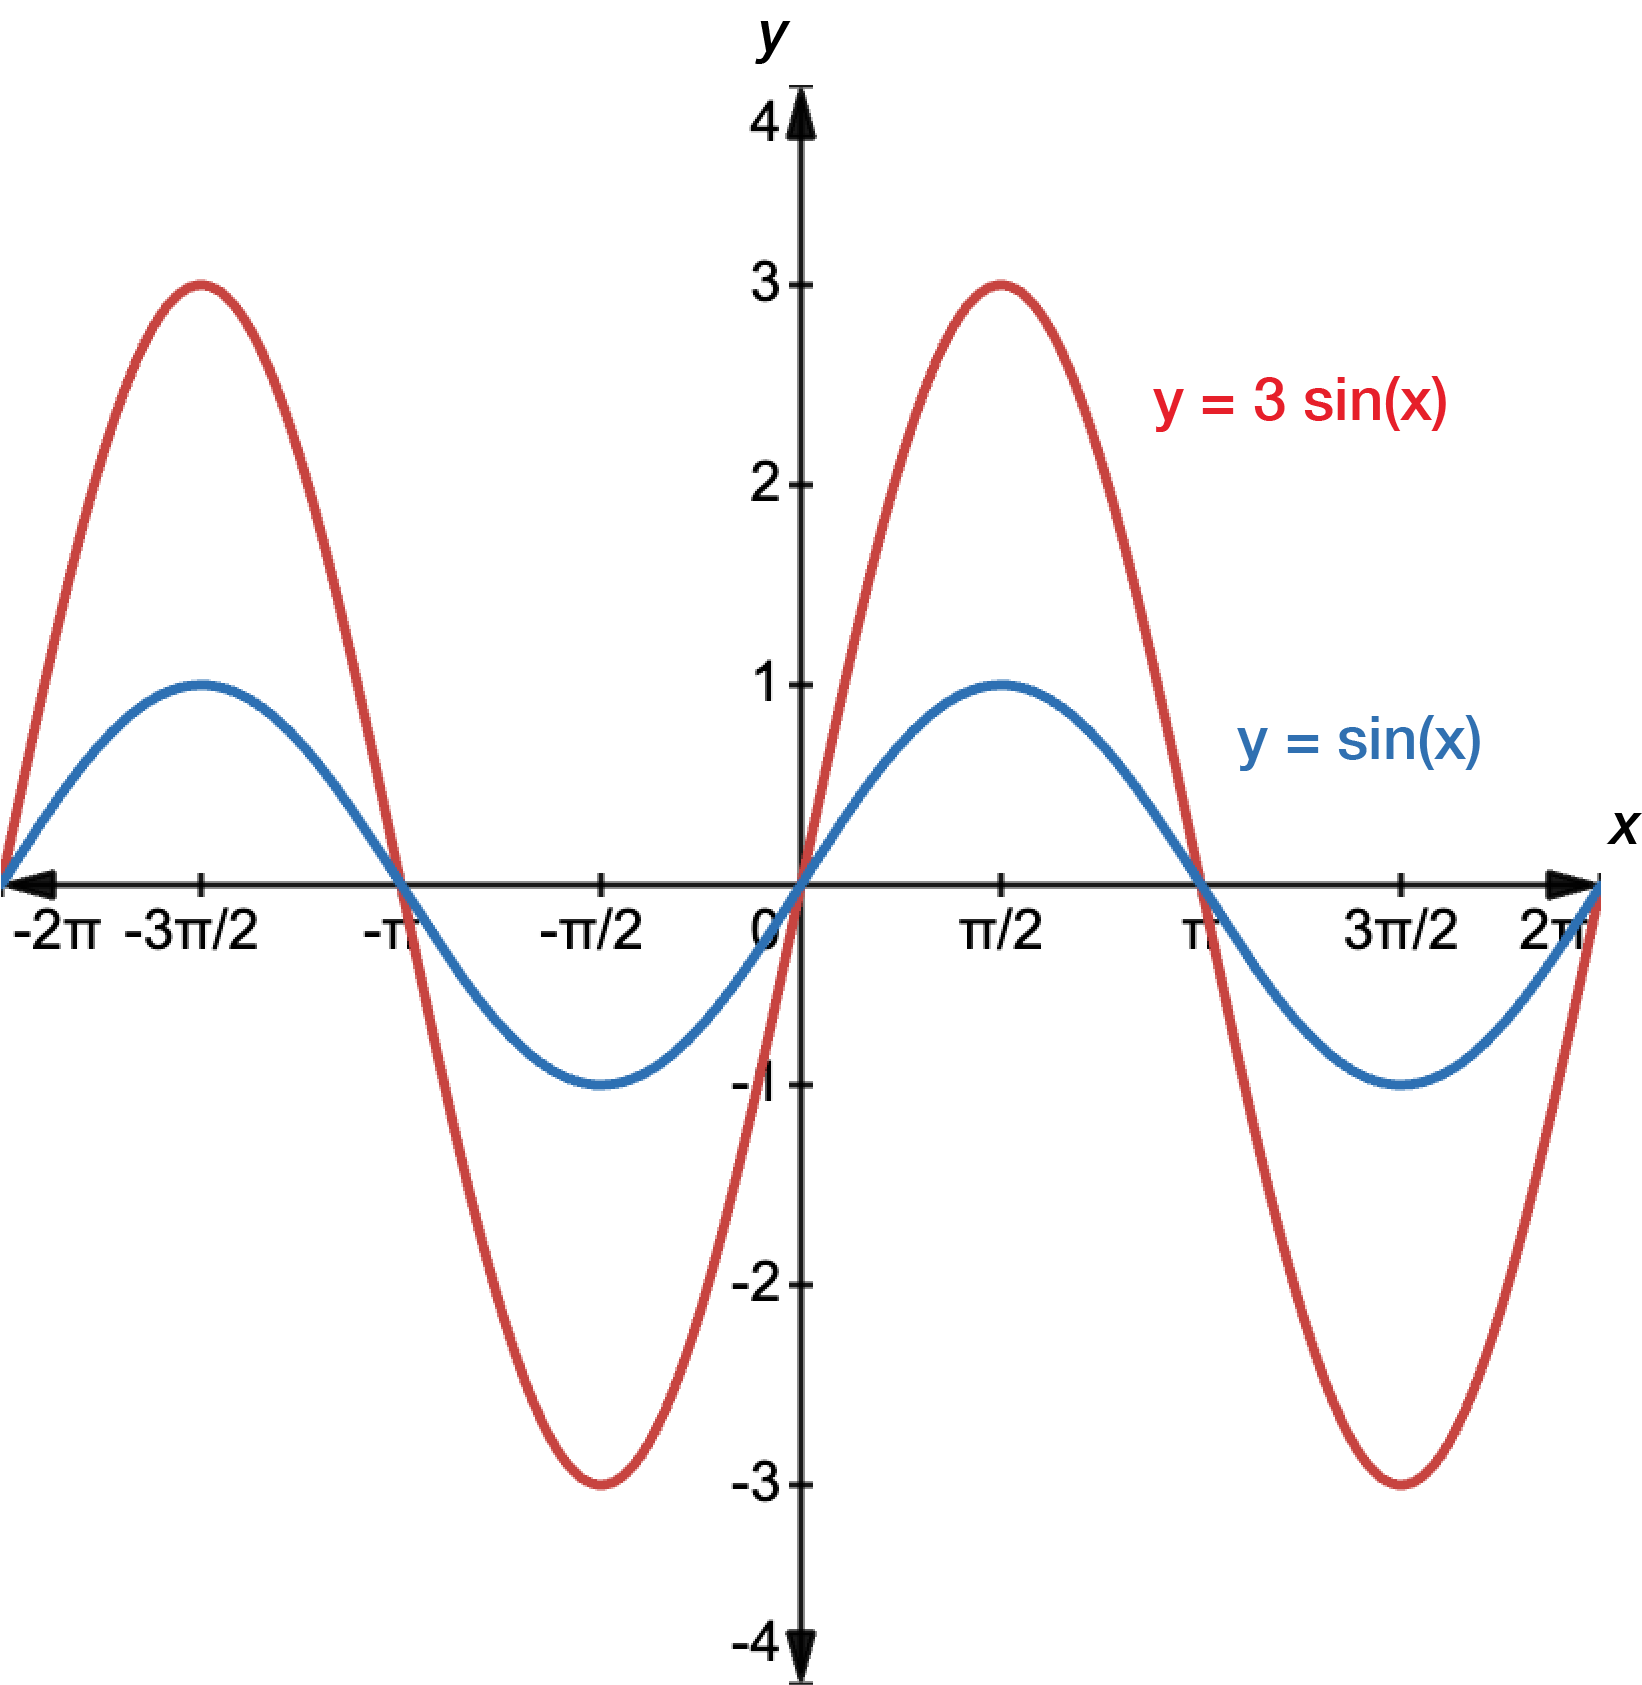
Graph \(y=3\sin(x)\).
Here, \(a=3\) and \(n=1\), so the graph has an amplitude of \(\left|3\right|=3\) and a period of \(\dfrac{2\pi}{n}=\dfrac{2\pi}{1}=2\).
Graph \(y=\sin(x)+2\).
\(k=2\) so the graph of \(y=\sin(x)\) is shifted \(2\) units up.
The graph shows \(y=\sin(x)\) in blue and \(y=\sin(x)+2\) in red.
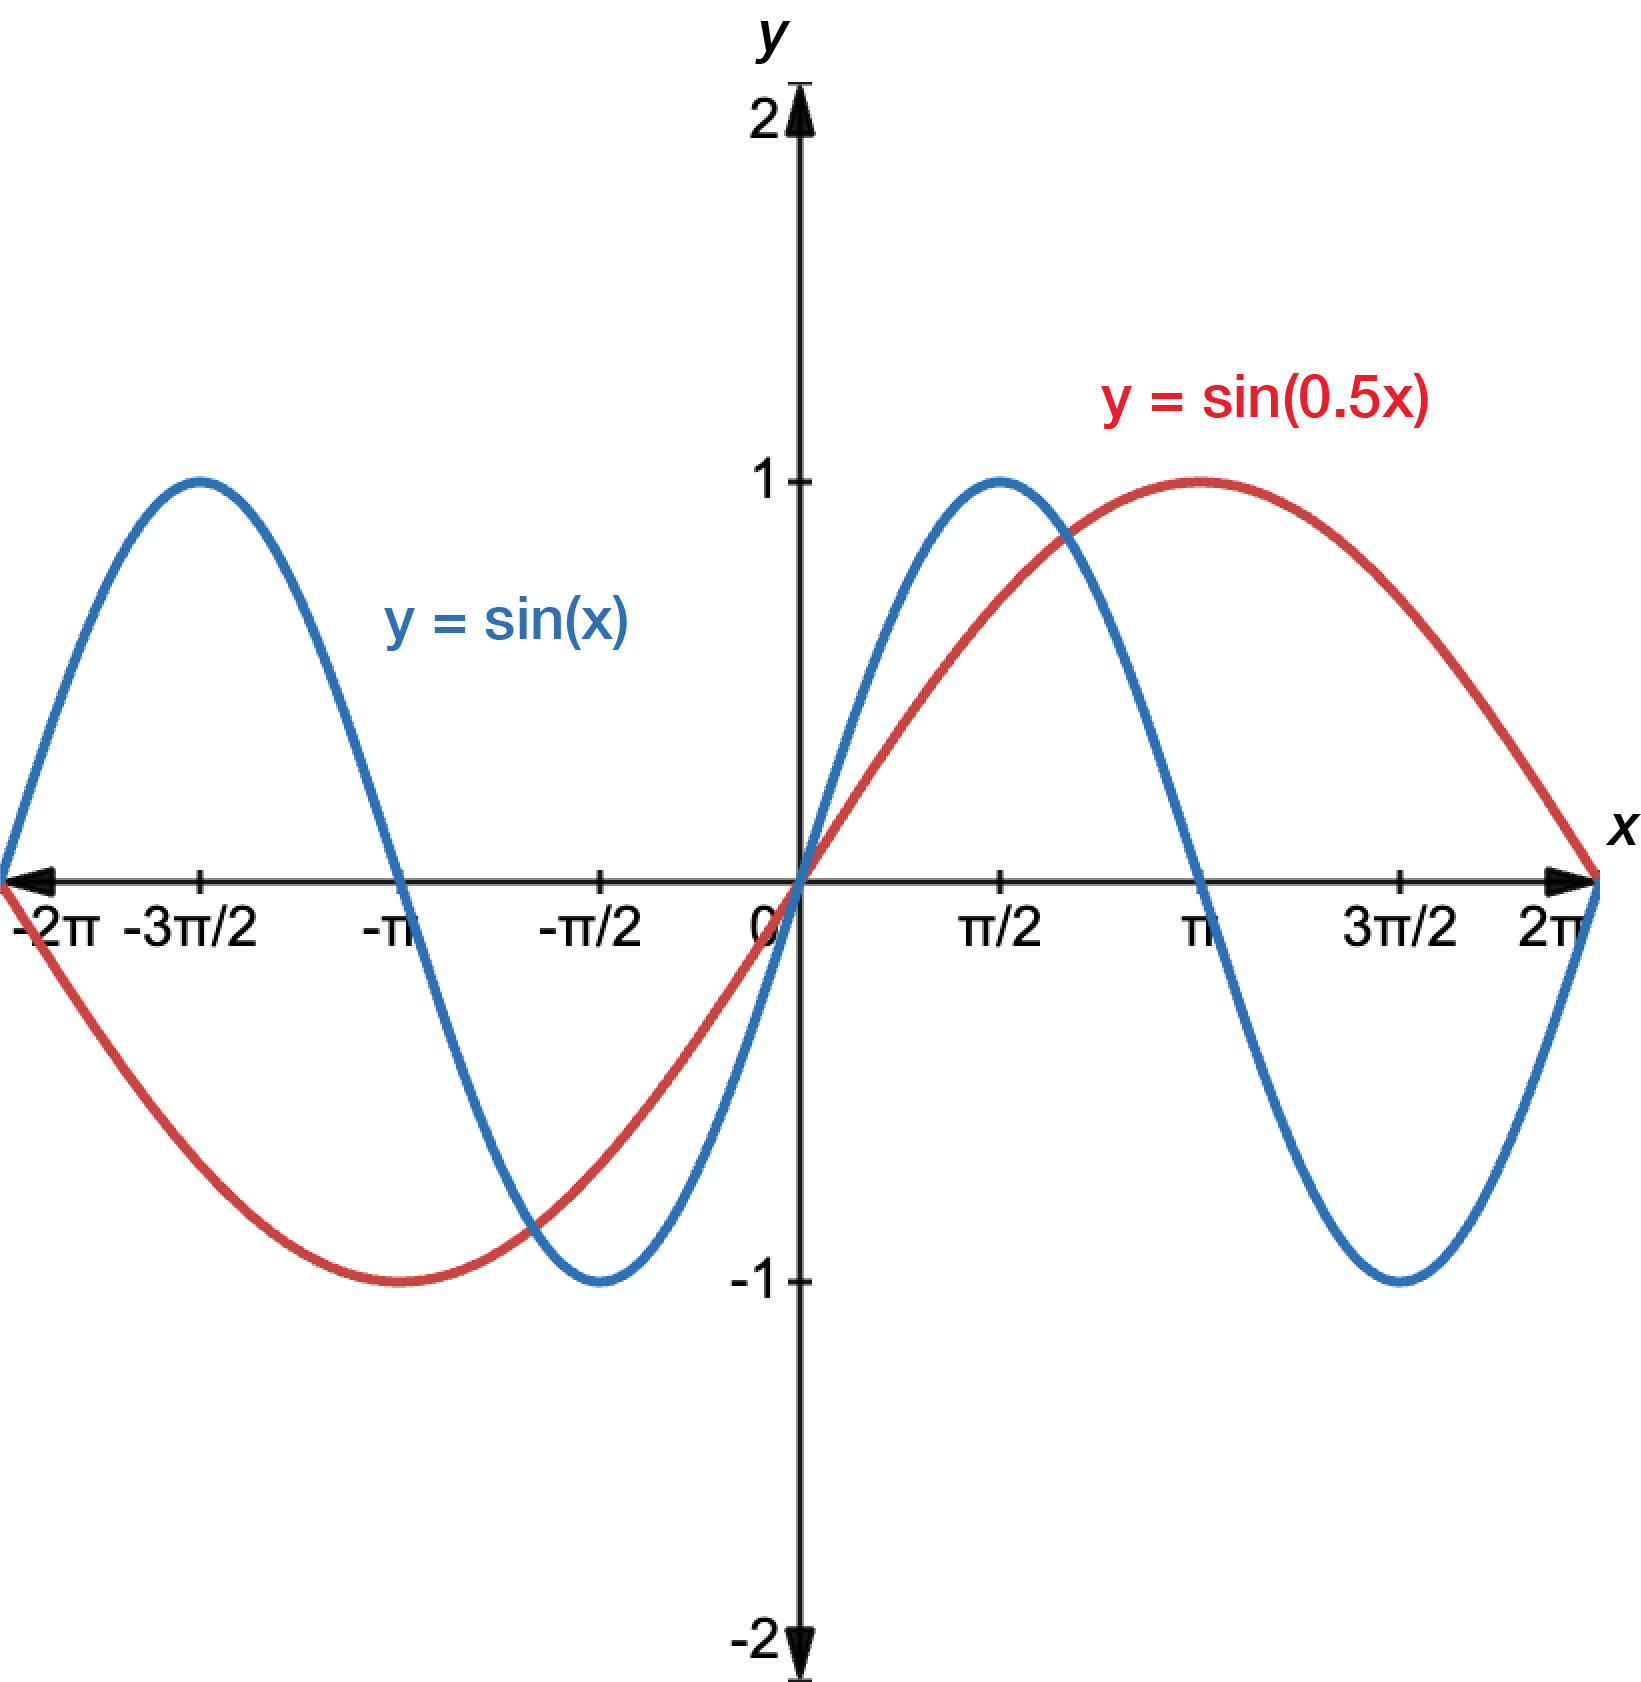
Graph \(y=\sin\left(\dfrac{1}{2}x\right)\).
\(n=\dfrac{1}{2}\), so the graph is stretched by a factor of \(\dfrac{1}{n}=\dfrac{1}{\frac{1}{2}}=2\).
The original graph of \(y=\sin(x)\) is shown in blue and the dilated \(y=\sin\left(\dfrac{1}{2}x\right)\) graph is shown in red.
The dilated graph has a period of \(4\pi\), which is twice that of the original graph \((2\pi)\).
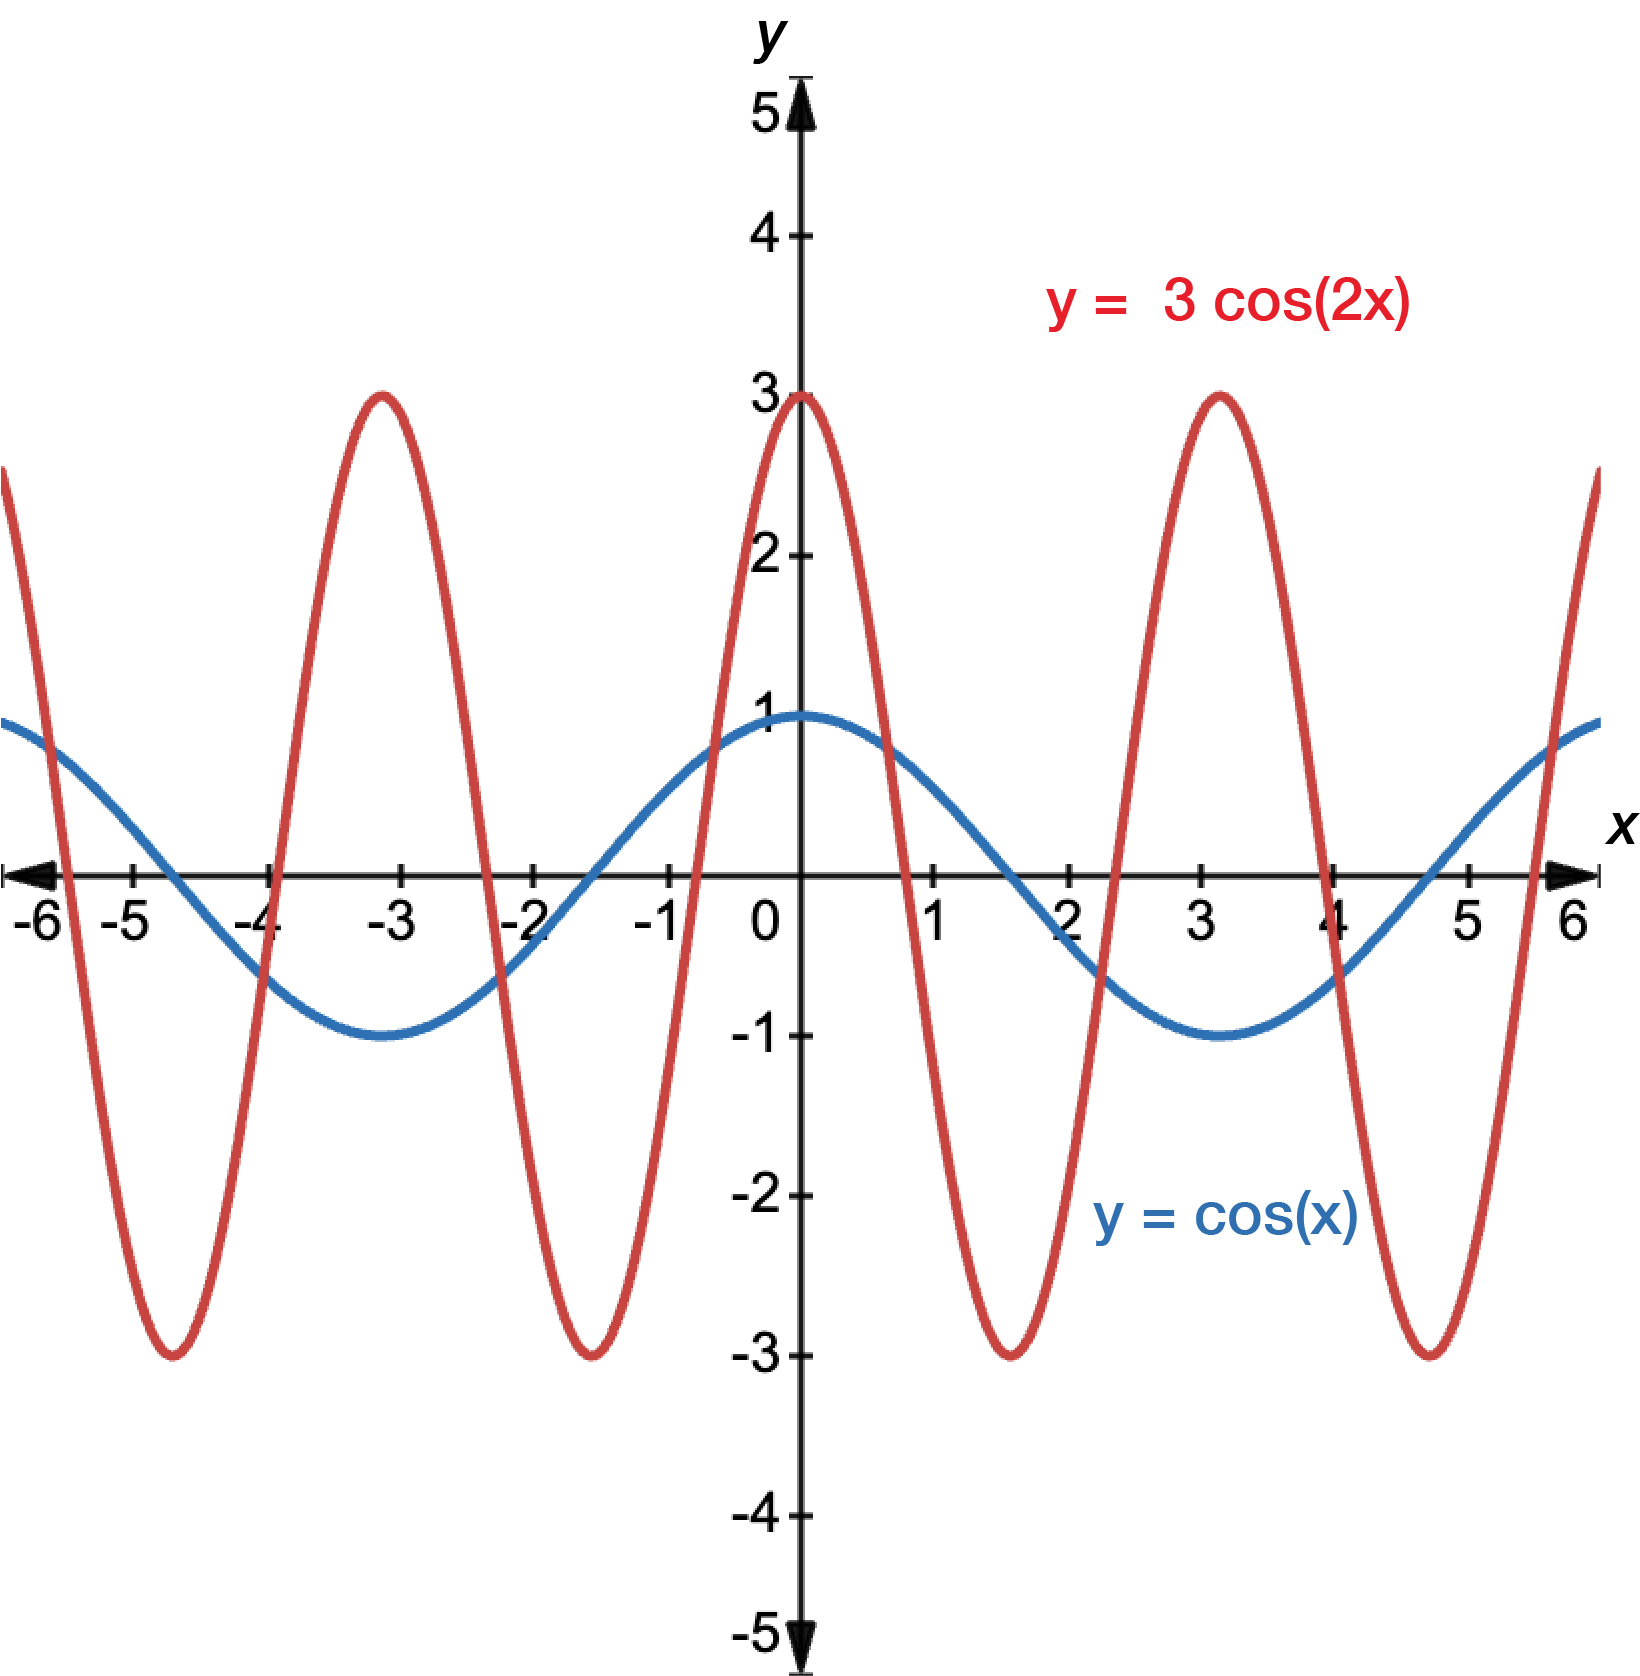
Graph \(y=3\cos(2x)\).
Here, \(a=3\) and \(n=2\), so the graph has an amplitude of \(\left|3\right|=3\) and a period of \(\dfrac{2\pi}{n}=\dfrac{2\pi}{2}=\pi\).
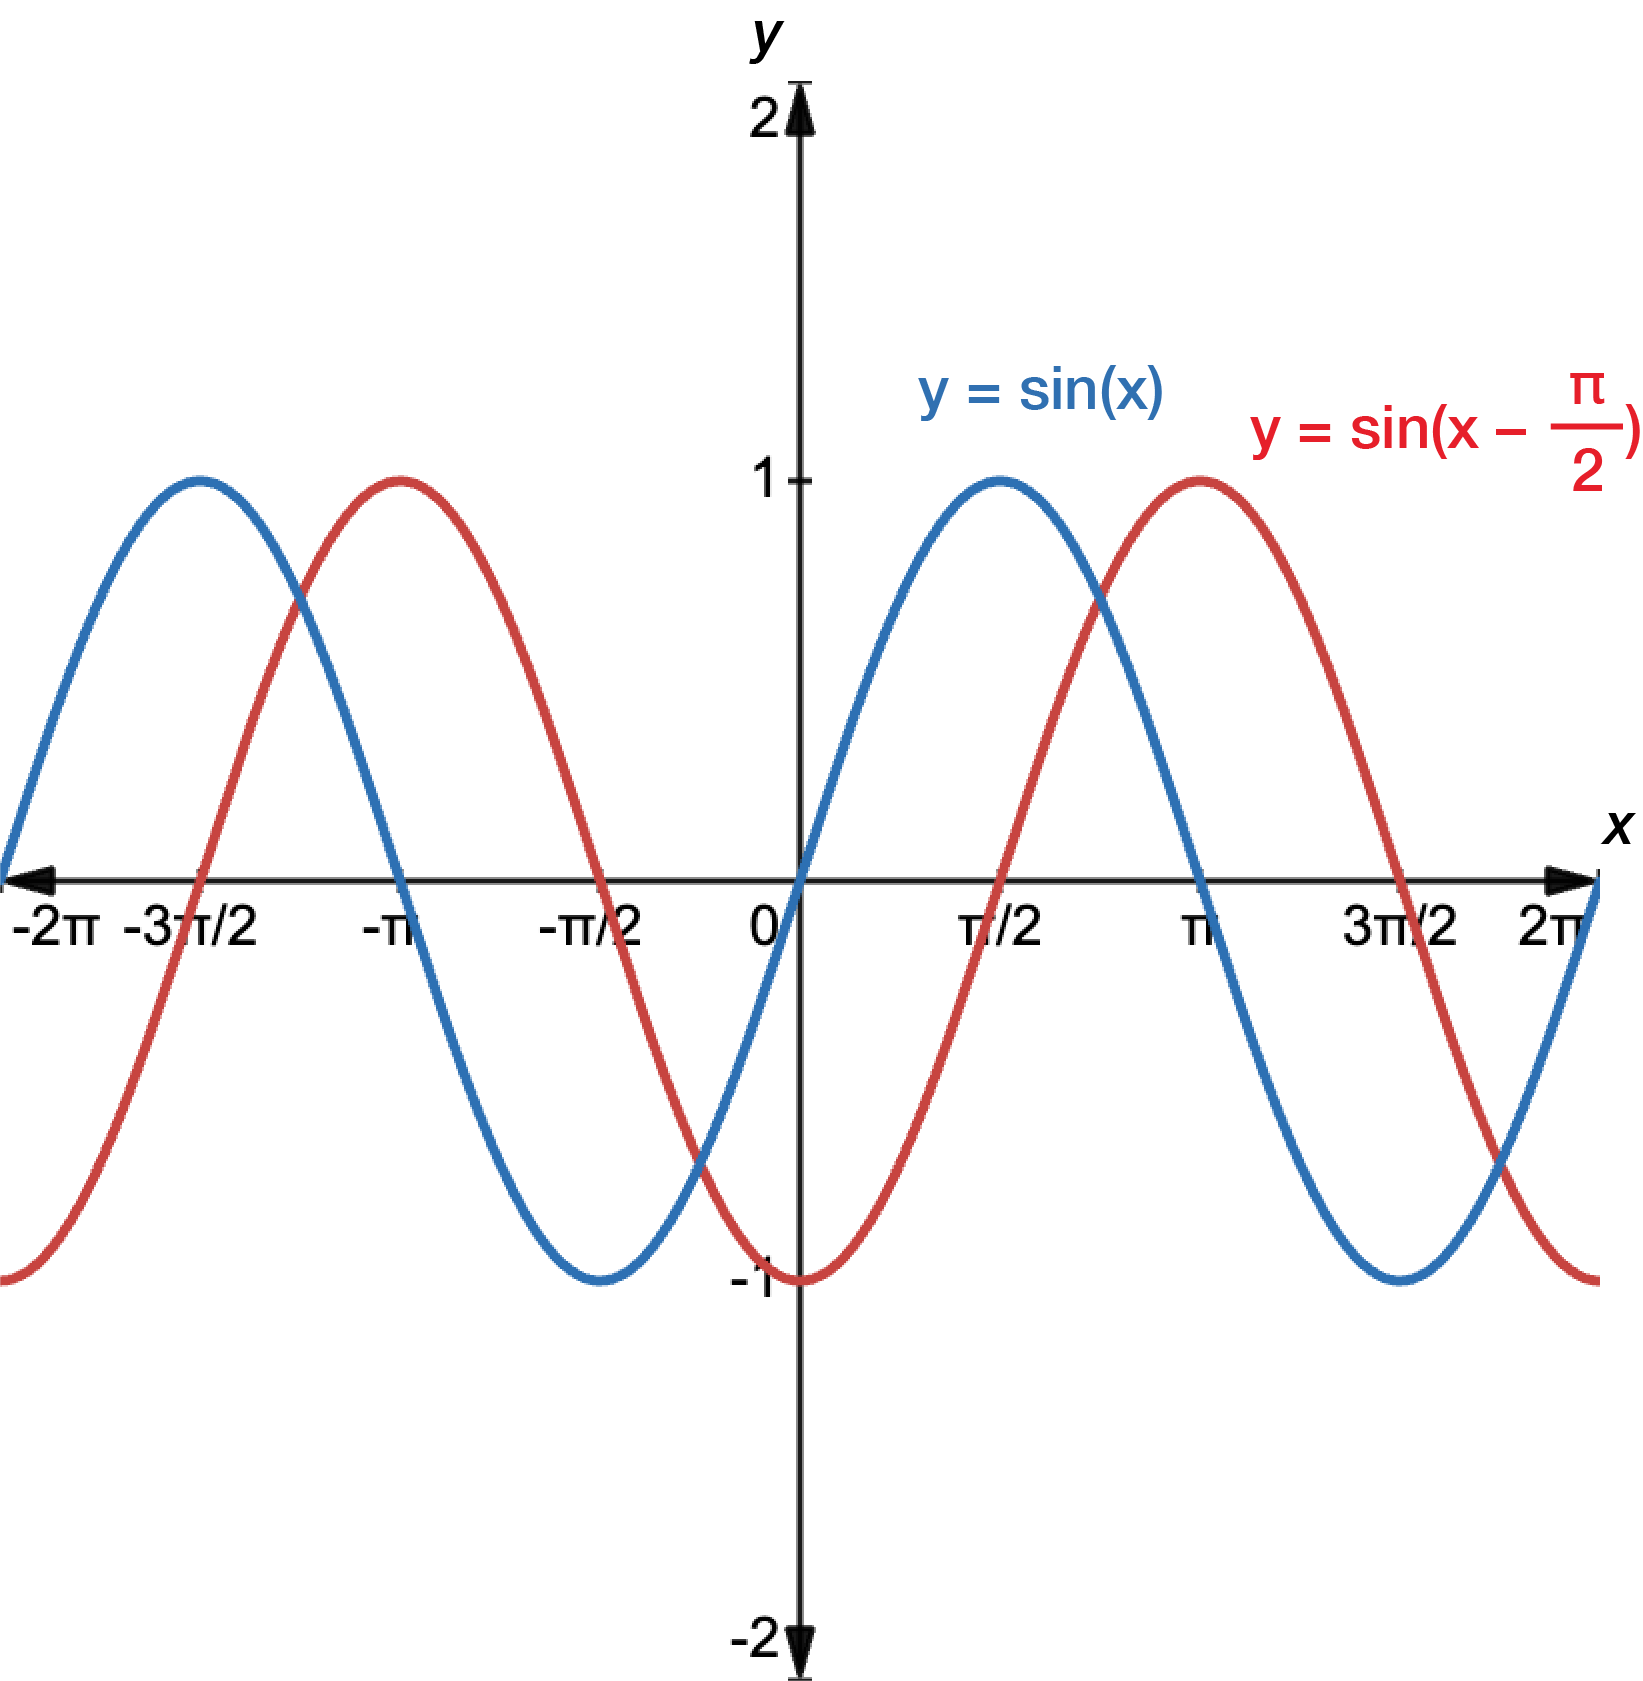
Graph \(y=\sin\left(x-\dfrac{\pi}{2}\right)\).
Here, \(\phi=\dfrac{\pi}{2}\), so the graph is shifted \(\dfrac{\pi}{2}\) units to the right.
In the graph, \(y=\sin\left(x-\dfrac{\pi}{2}\right)\) is shown with a solid blue line, superimposed on the graph of \(y=\sin(x)\), shown with a dashed red line.
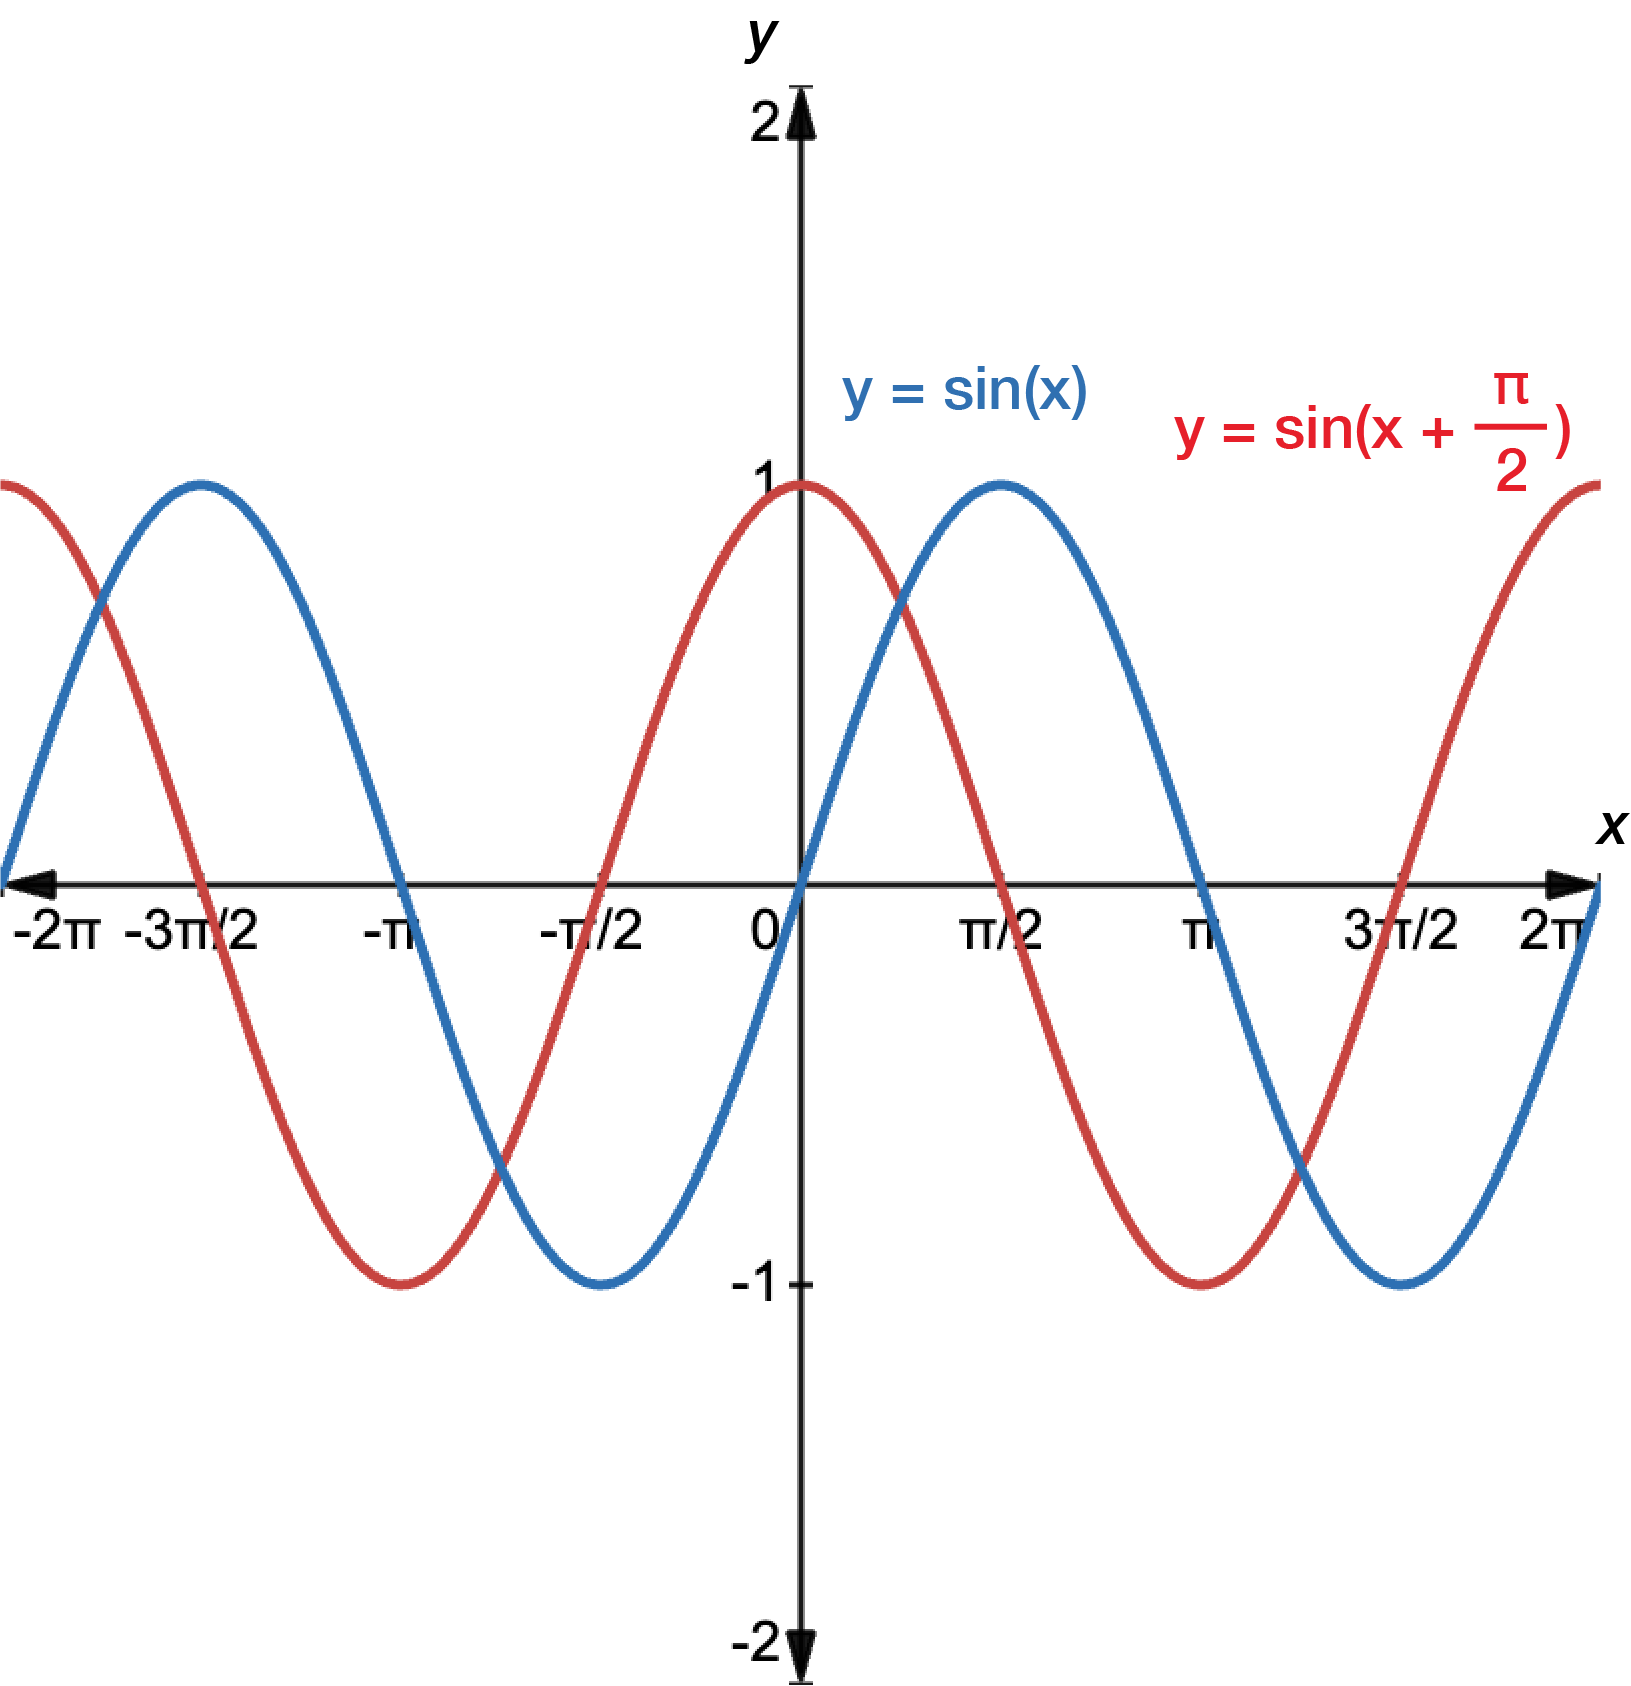
Graph \(y=\sin\left(x+\dfrac{\pi}{2}\right)\).
Here, \(\phi=-\dfrac{\pi}{2}\), so the graph is shifted \(\dfrac{\pi}{2}\) units to the left.
In the graph, \(y=\sin\left(x+\dfrac{\pi}{2}\right)\) is shown with a solid red line, superimposed on the graph of \(y=\sin(x)\), shown with a blue line.
This is an interesting example as the translation converts the sine function to the cosine function. To see this, recall the trigonometry identity: \[\sin(a+b) = \sin(a)\cos(b)+\cos(a)\sin(b)\]
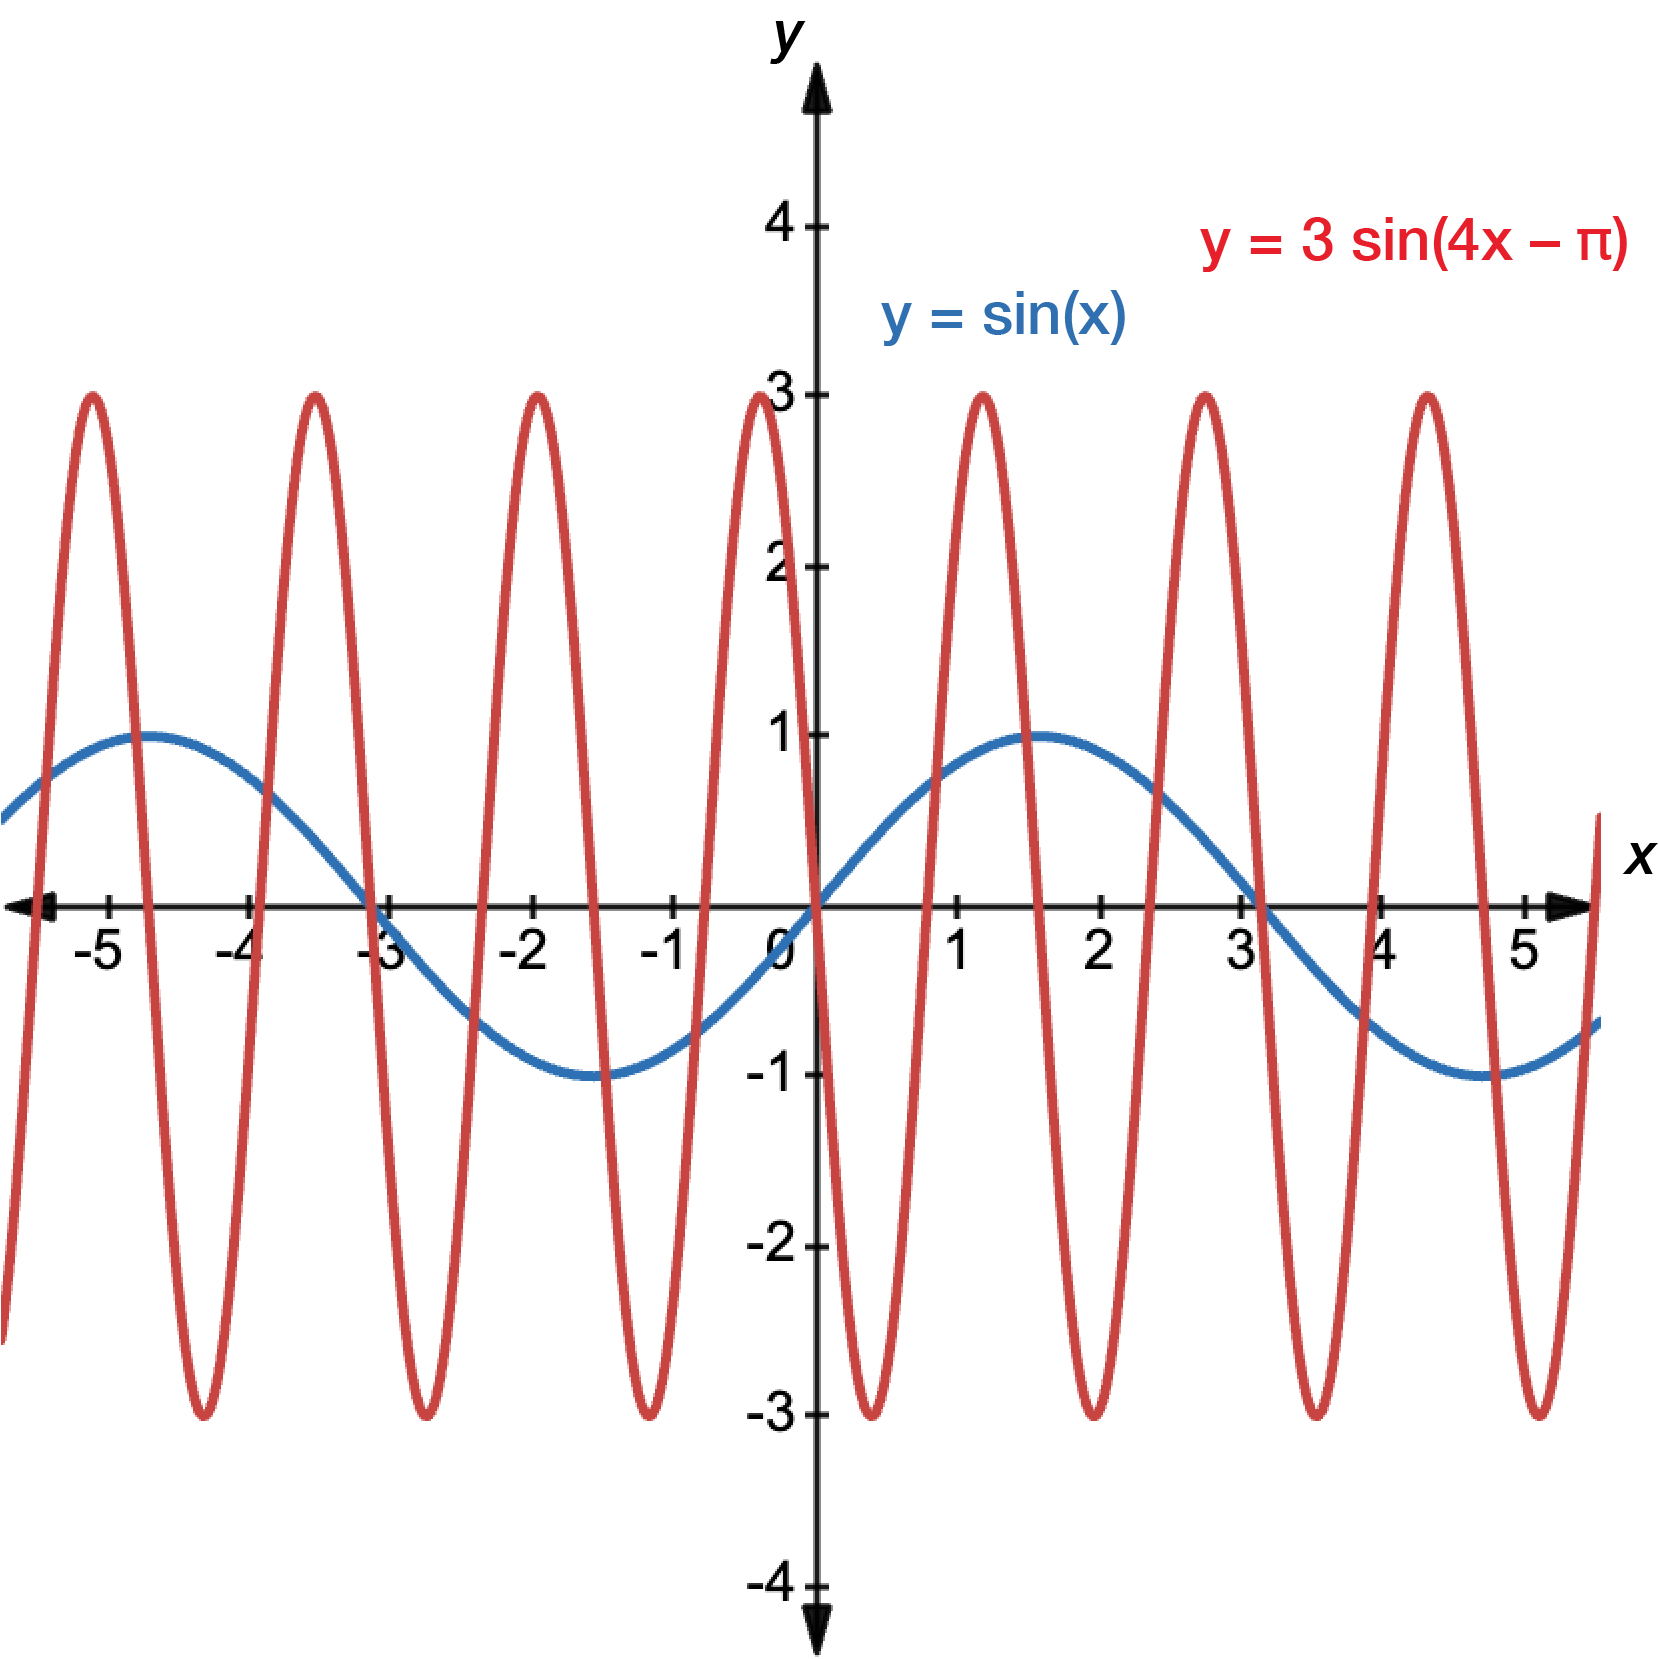
First, we can change \(y=3\sin(4x-\pi)\) to the form \(y=3\sin(4(x-\dfrac{\pi}{4}))\) to help with the transformation.
The amplitude is \(\left|3\right|=3\). The period is \(\dfrac{2\pi}{n}=\dfrac{2\pi}{4}=\dfrac{\pi}{2}\).
\(\phi=\dfrac{\pi}{4}\) so the graph is shifted \(\dfrac{\pi}{4}\) units to the right.
In the graph, \(y=3\sin(4x-\pi)\) is shown with a solid black line, superimposed on the graph of \(y=3\sin(x)\), shown with a dotted red line and \(y=3\sin(4x)\), shown with a dashed blue line.
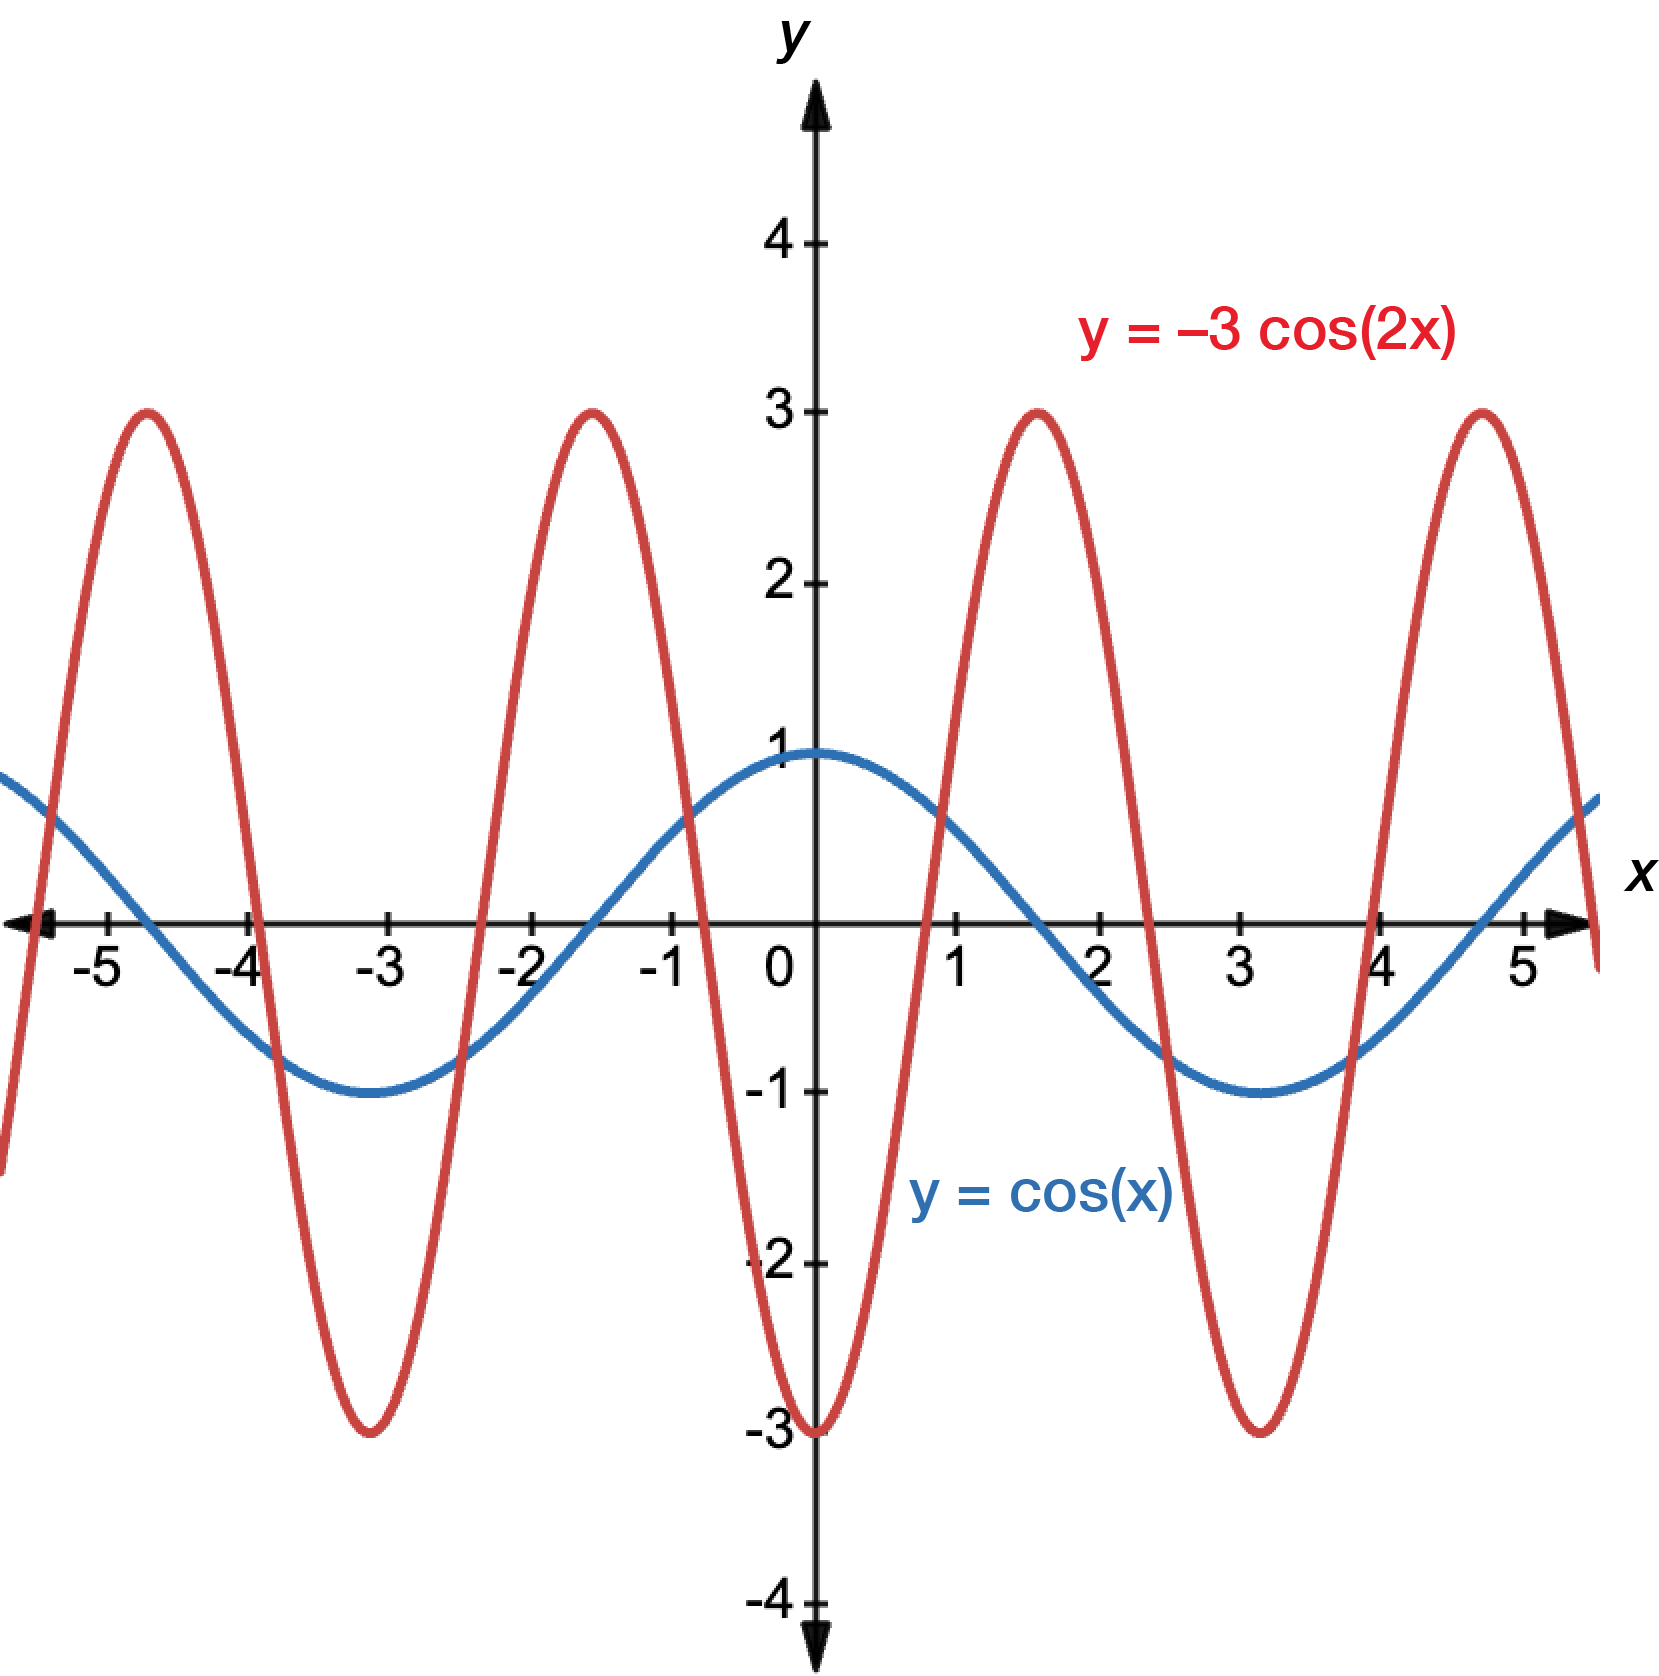
Graph \(y=-3\cos(2x)\).
The amplitude is \(\left|-3\right|=3\). The period is \(\dfrac{2\pi}{n}=\dfrac{2\pi}{2}=\pi\). Since \(a\) is negative, the normal \(y=3\cos(2x)\) graph is reflected about the \(x\)-axis.
In the graph, \(y=-3\cos(2x)\) is shown with a black line, superimposed on the graph of \(y=3\cos2x\), shown with a dotted line.
Exercise
Sketch the graphs of the following functions for one complete cycle, and state the amplitude and period.
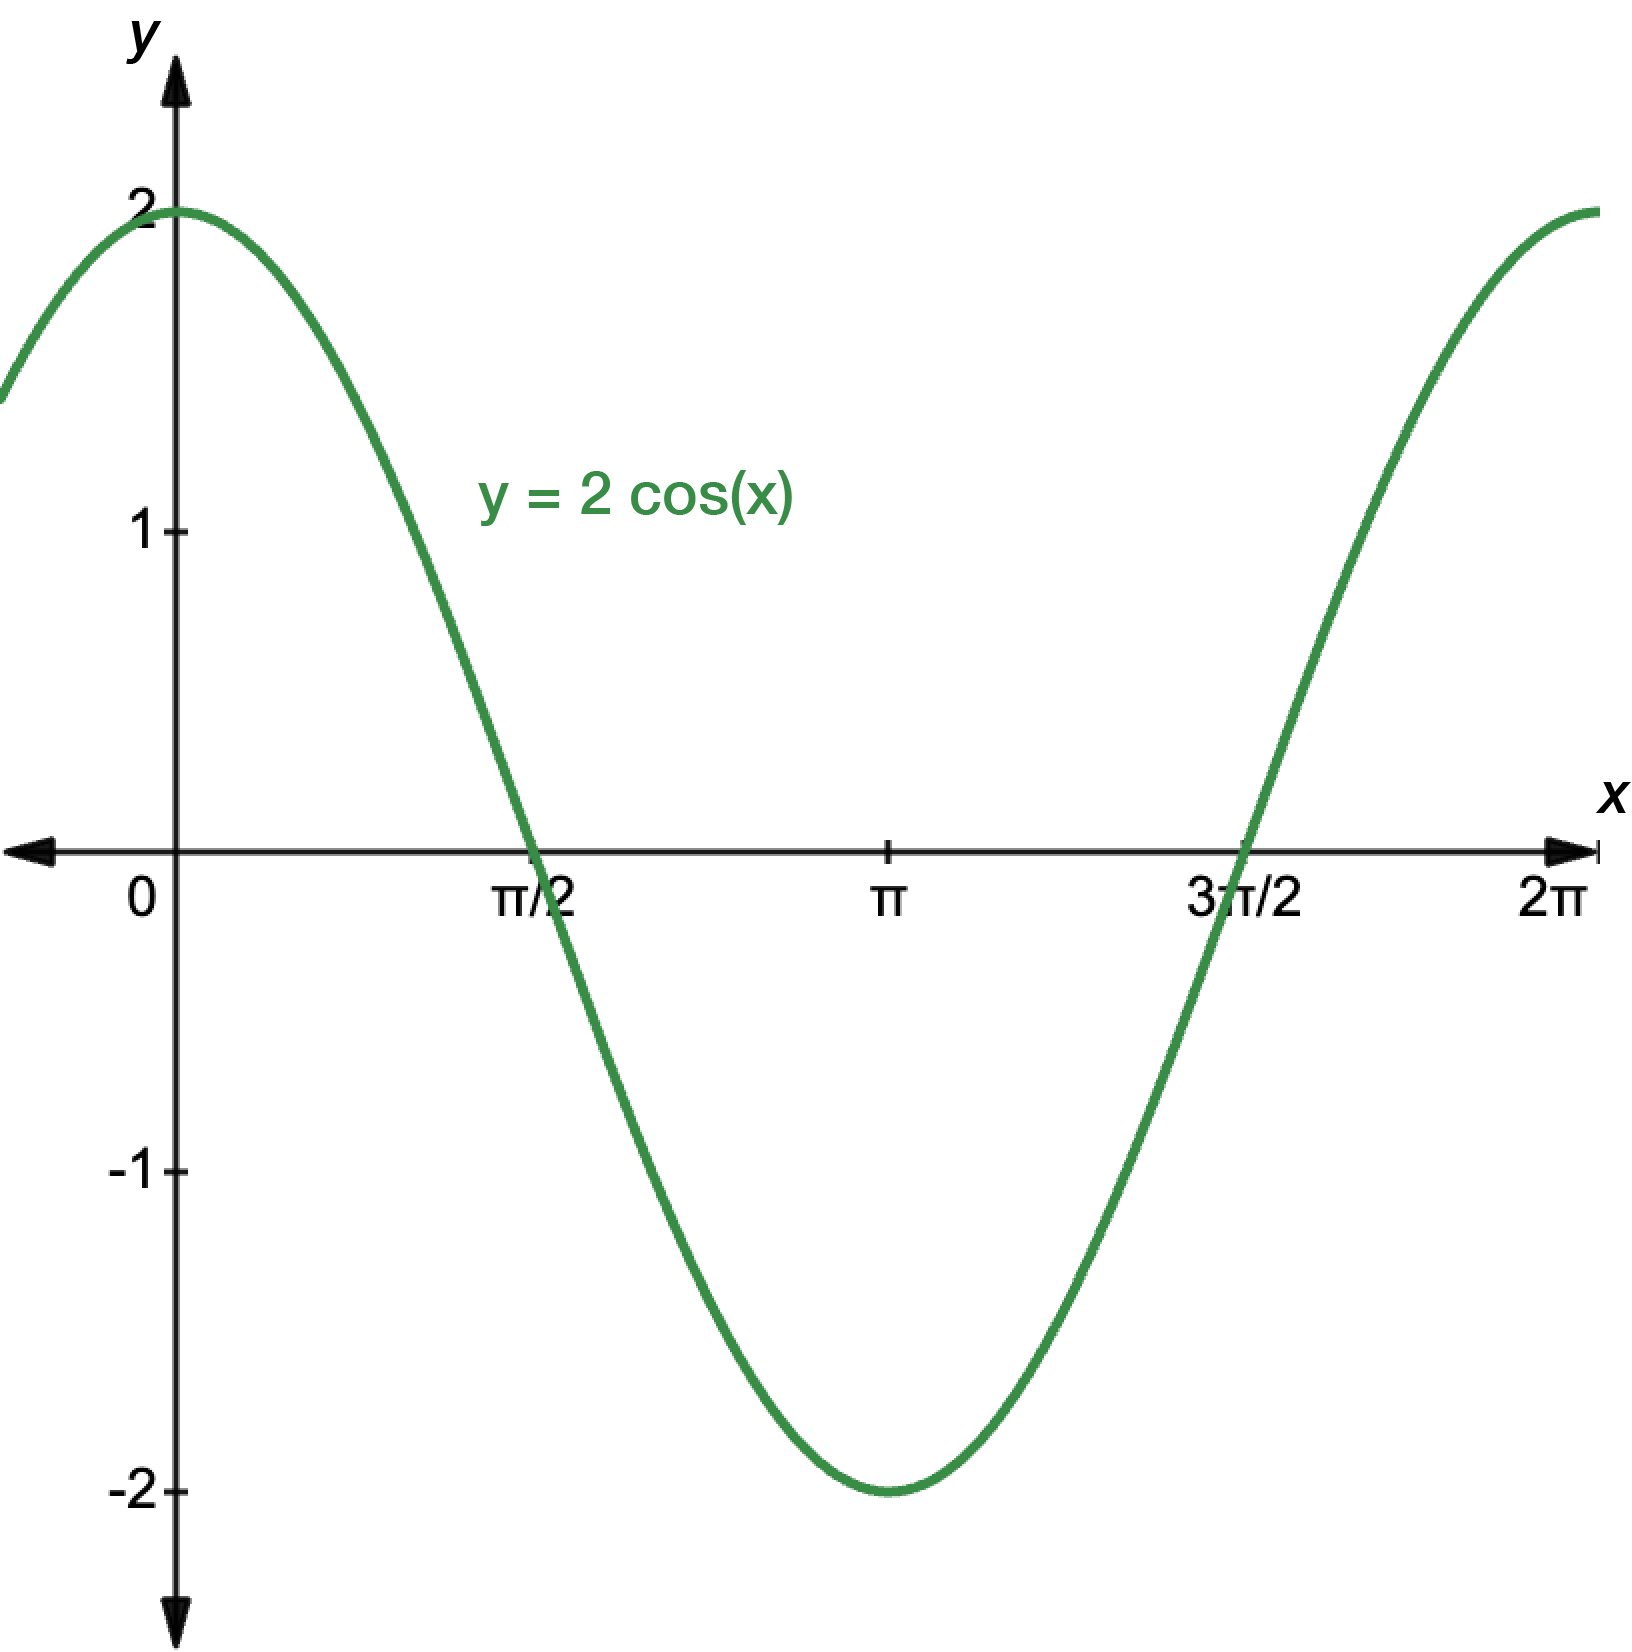
\(y=2\cos(x)\)
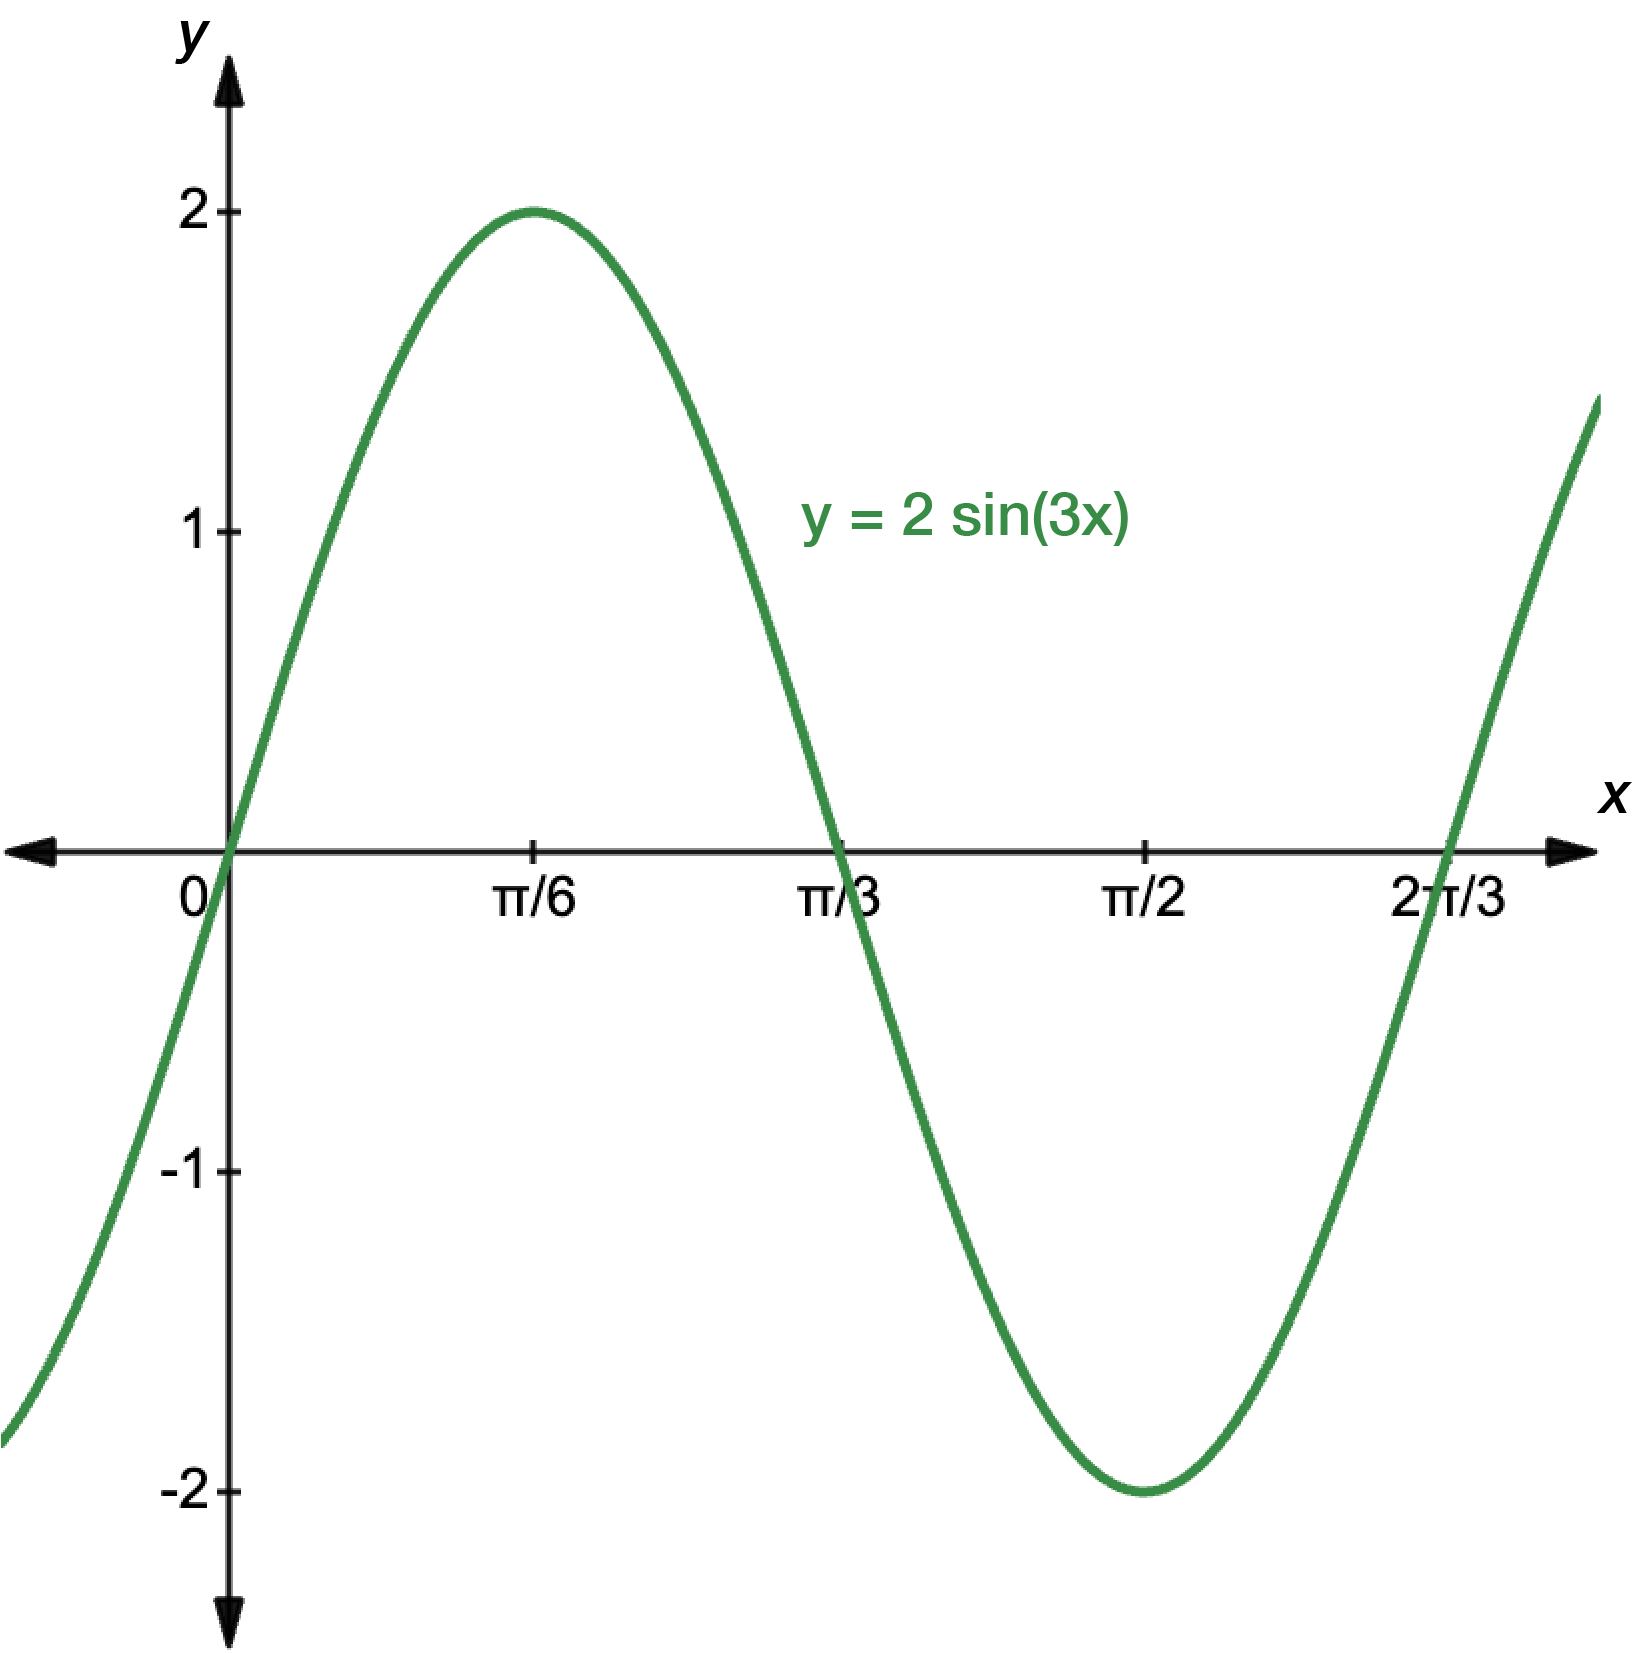
\(y=2\sin(3x)\)
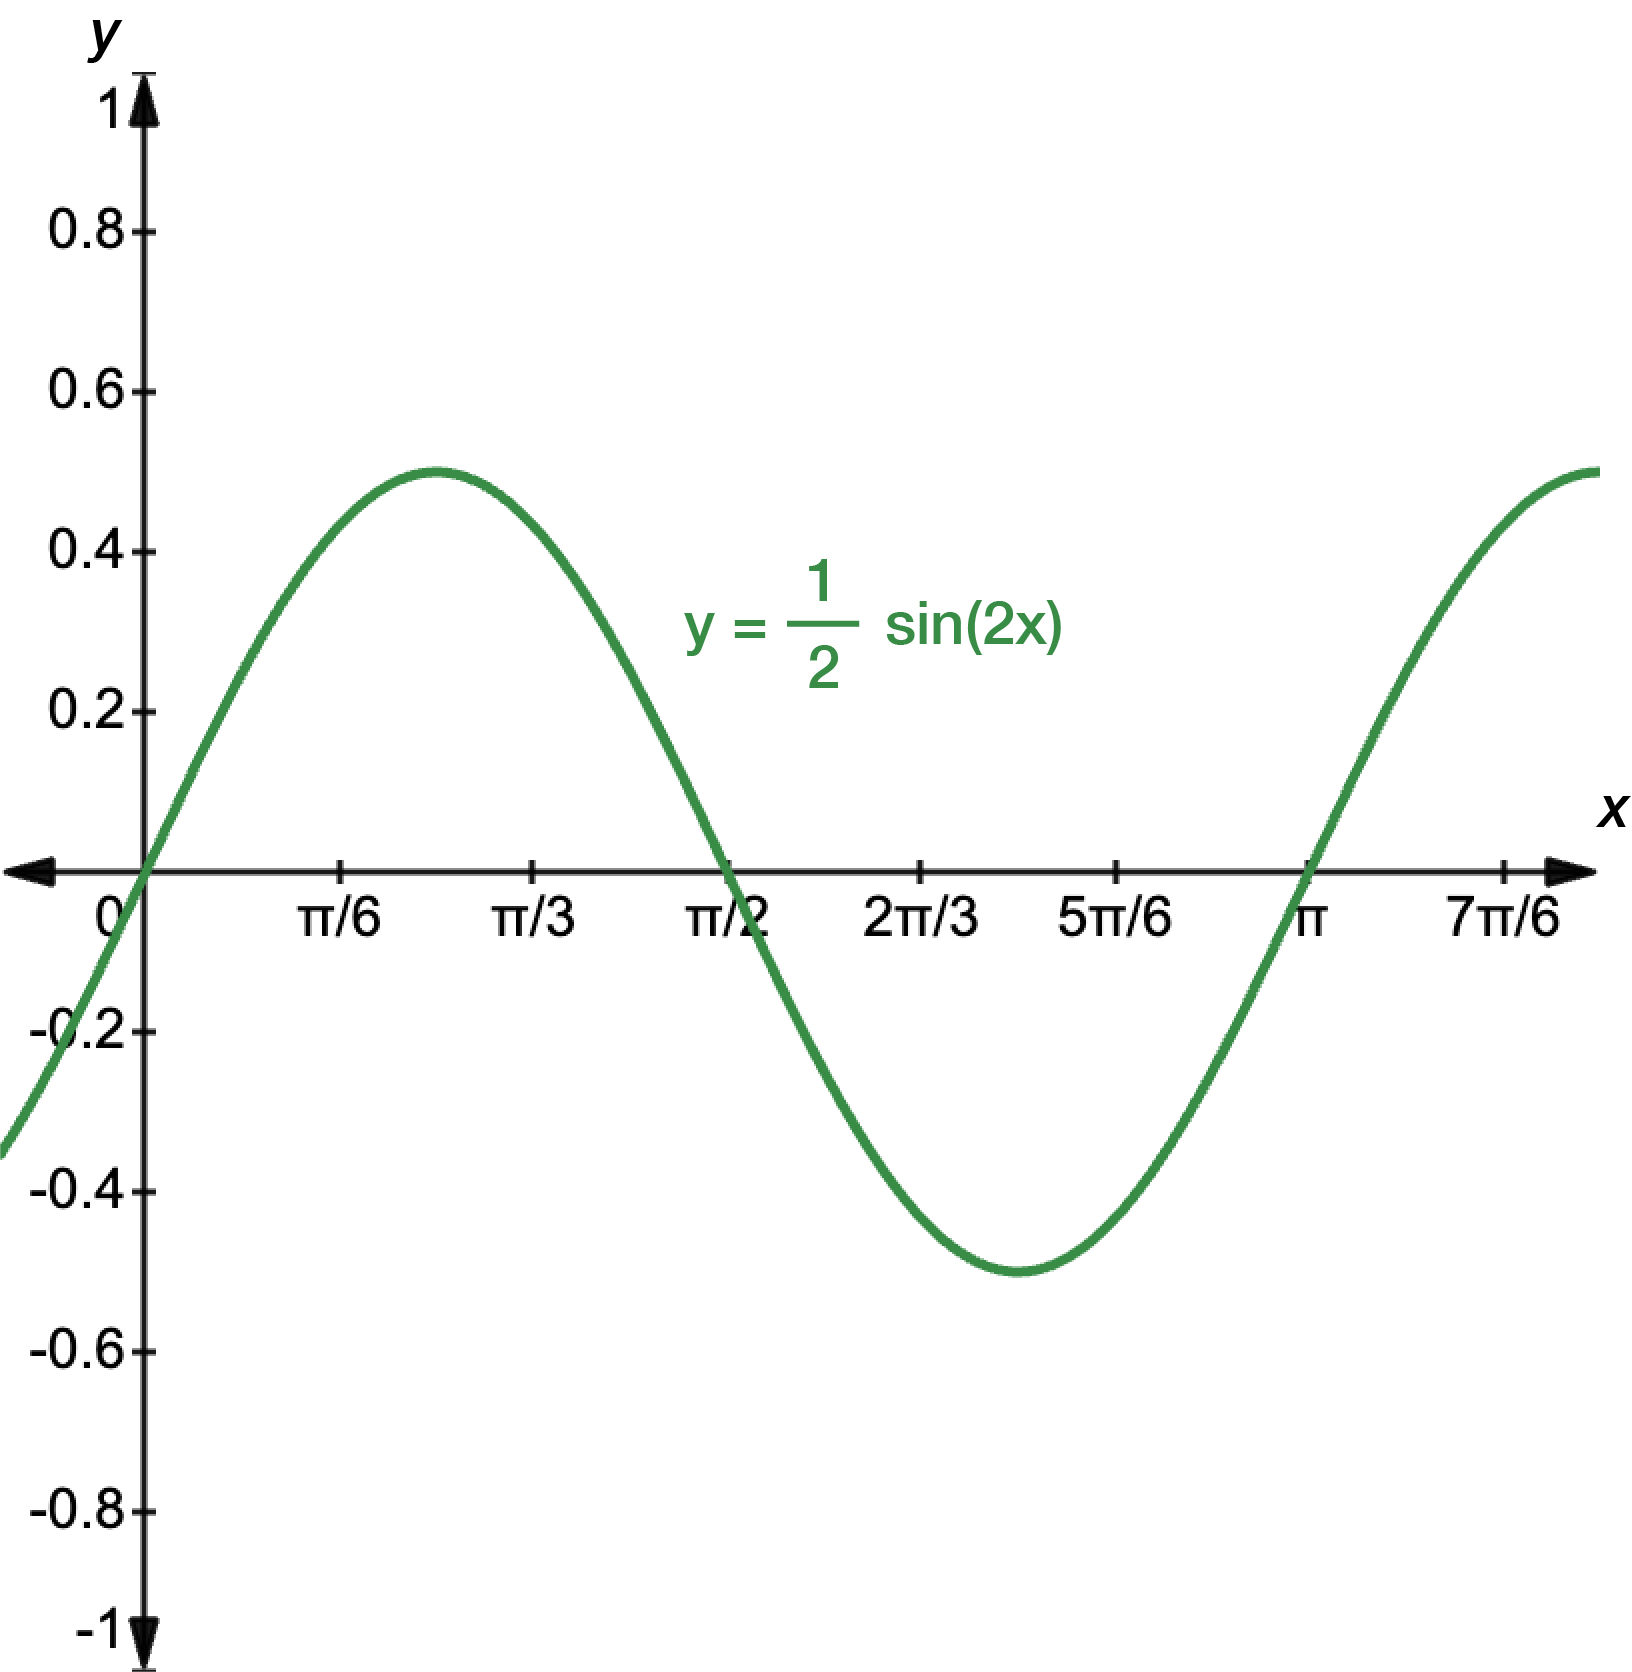
\(y=\dfrac{1}{2}\sin(2x)\)
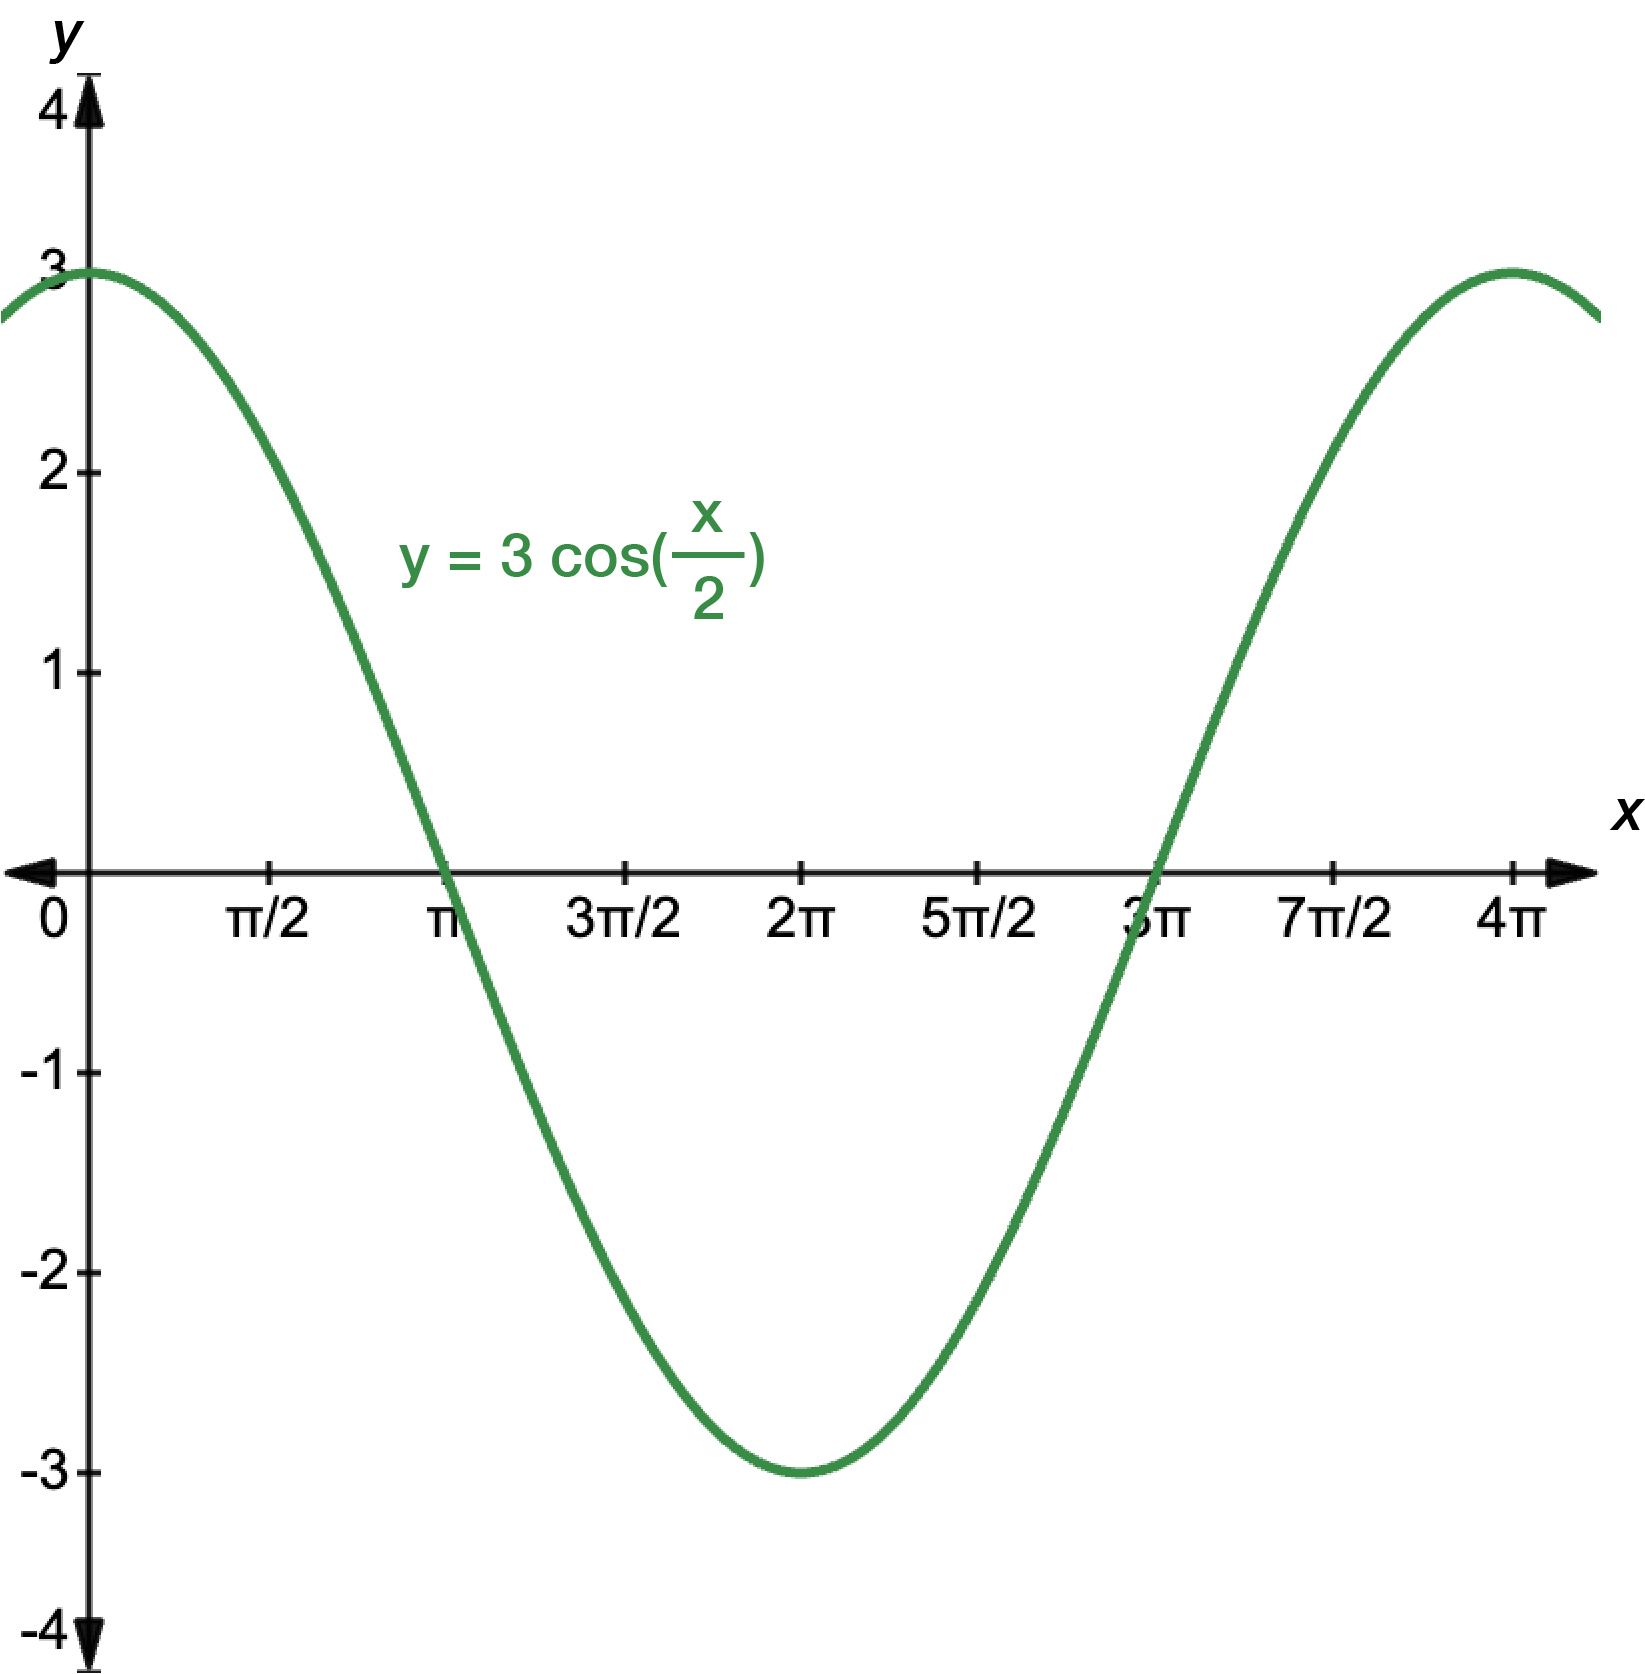
\(y=3\cos\left(\dfrac{x}{2}\right)\)
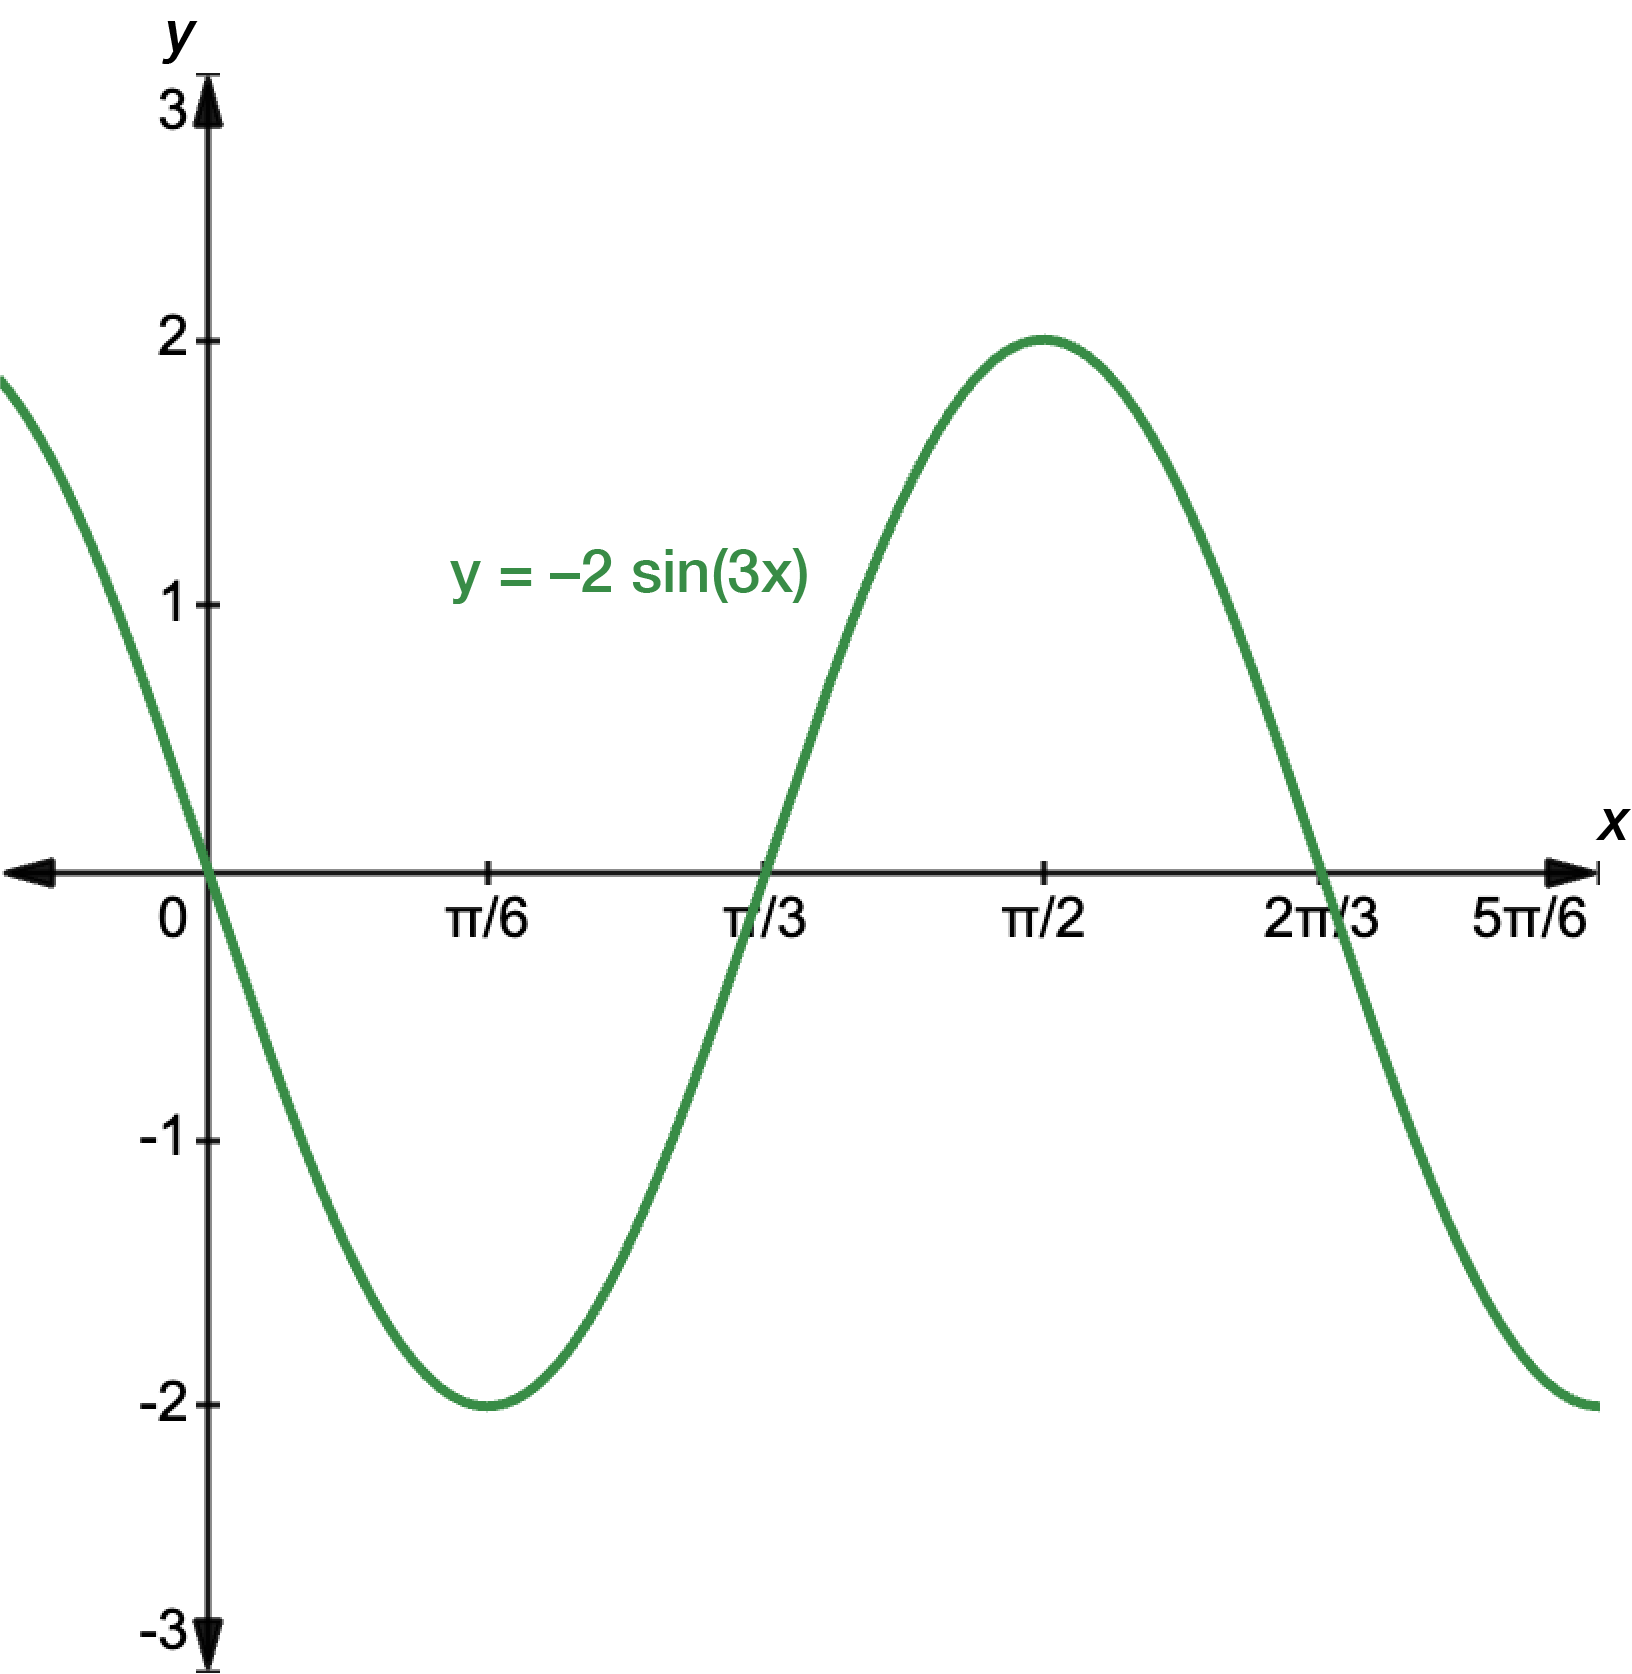
\(y=-2\sin(3x)\)
Sketch the graphs of the following functions for one complete cycle, and state the amplitude and period.
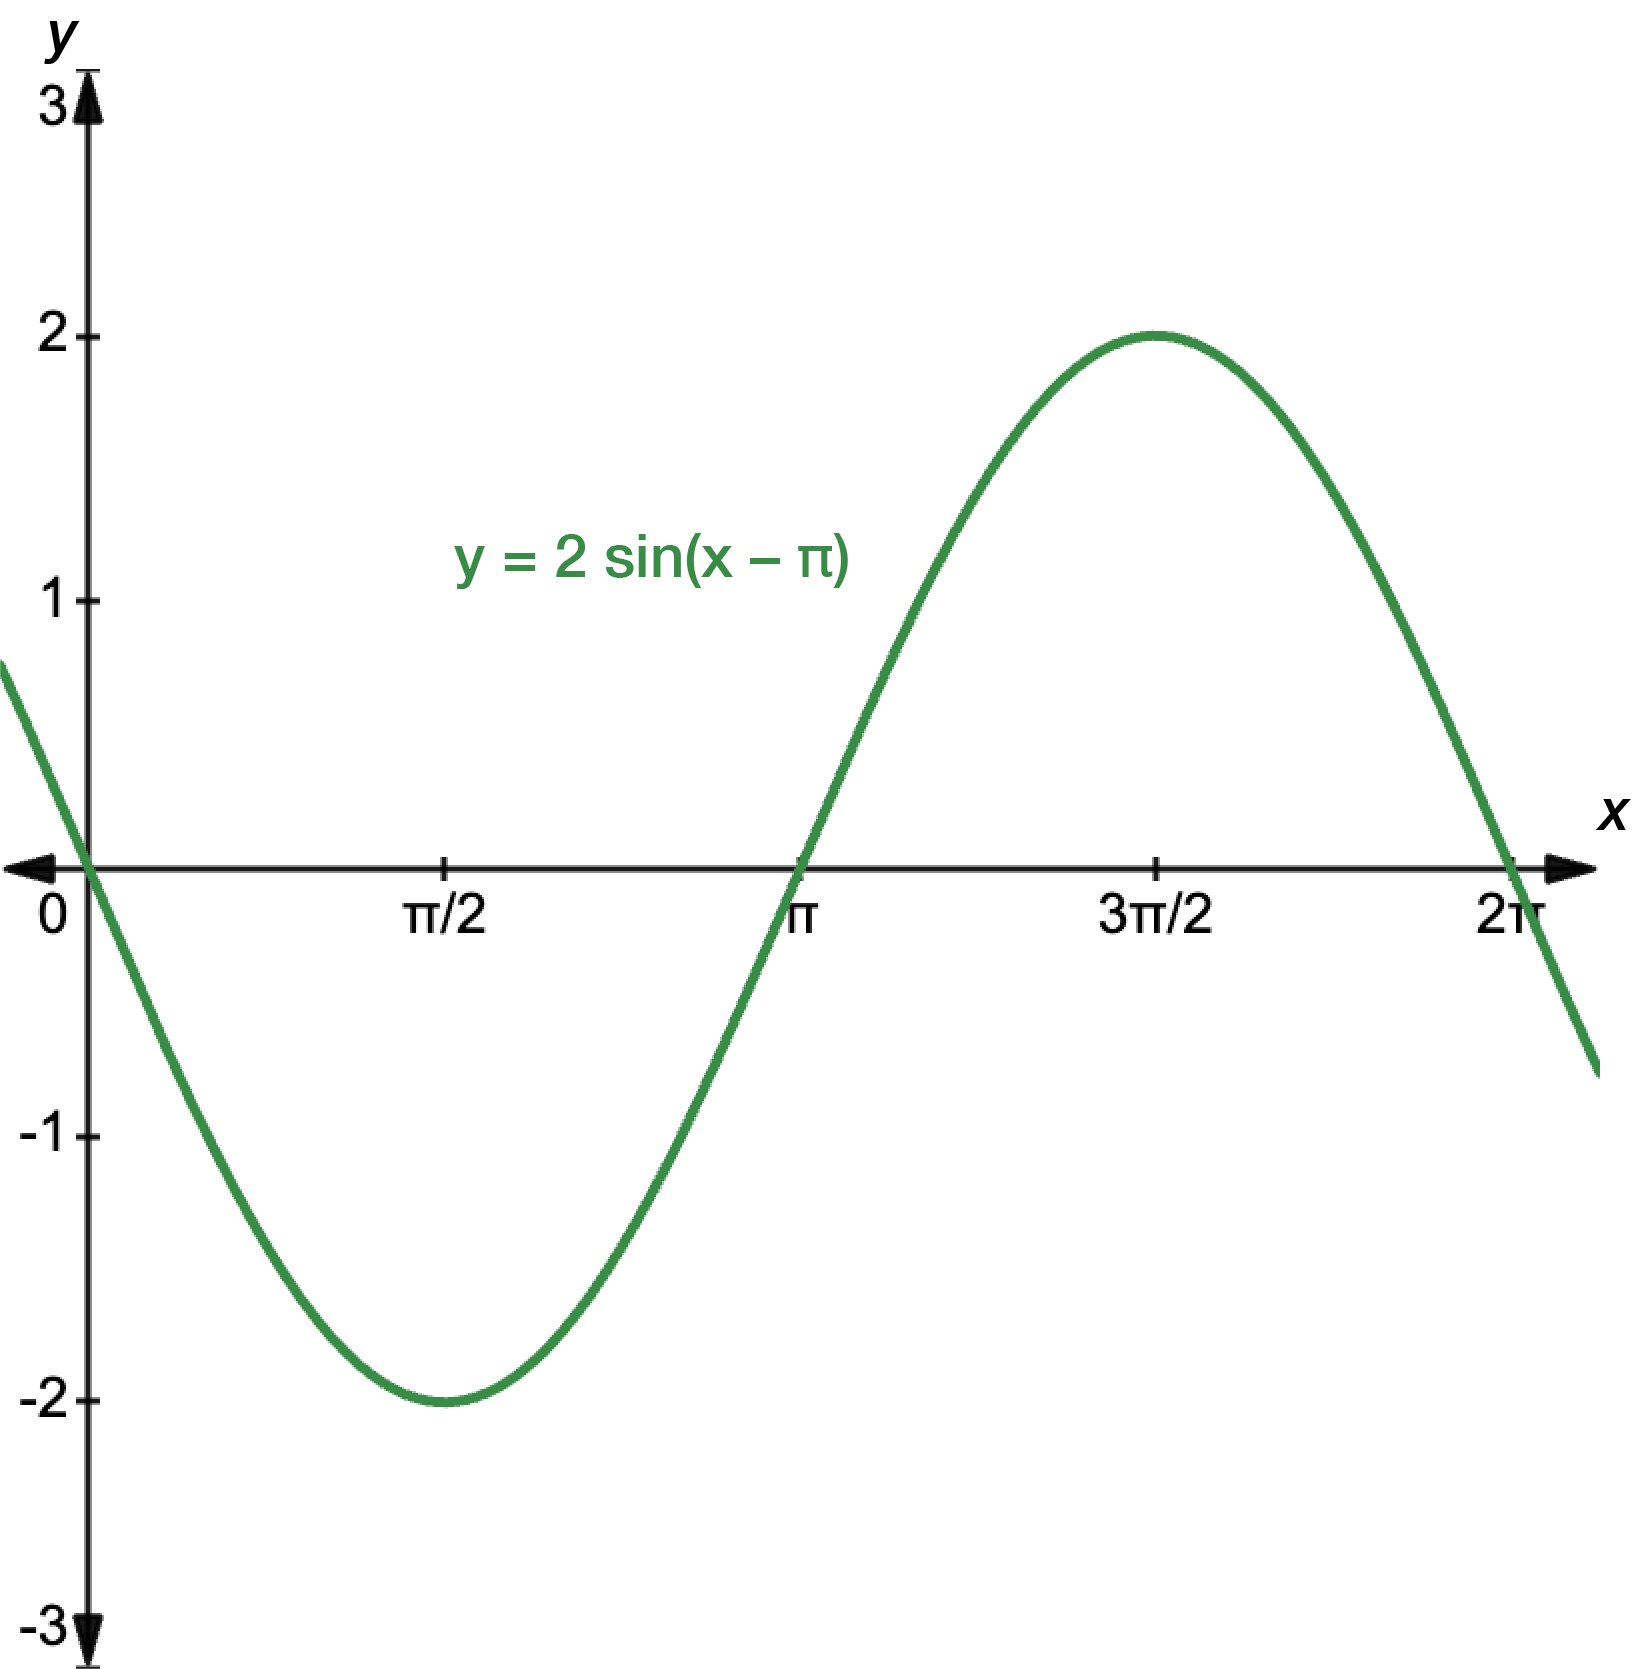
\(y=2\sin(x-\pi)\)
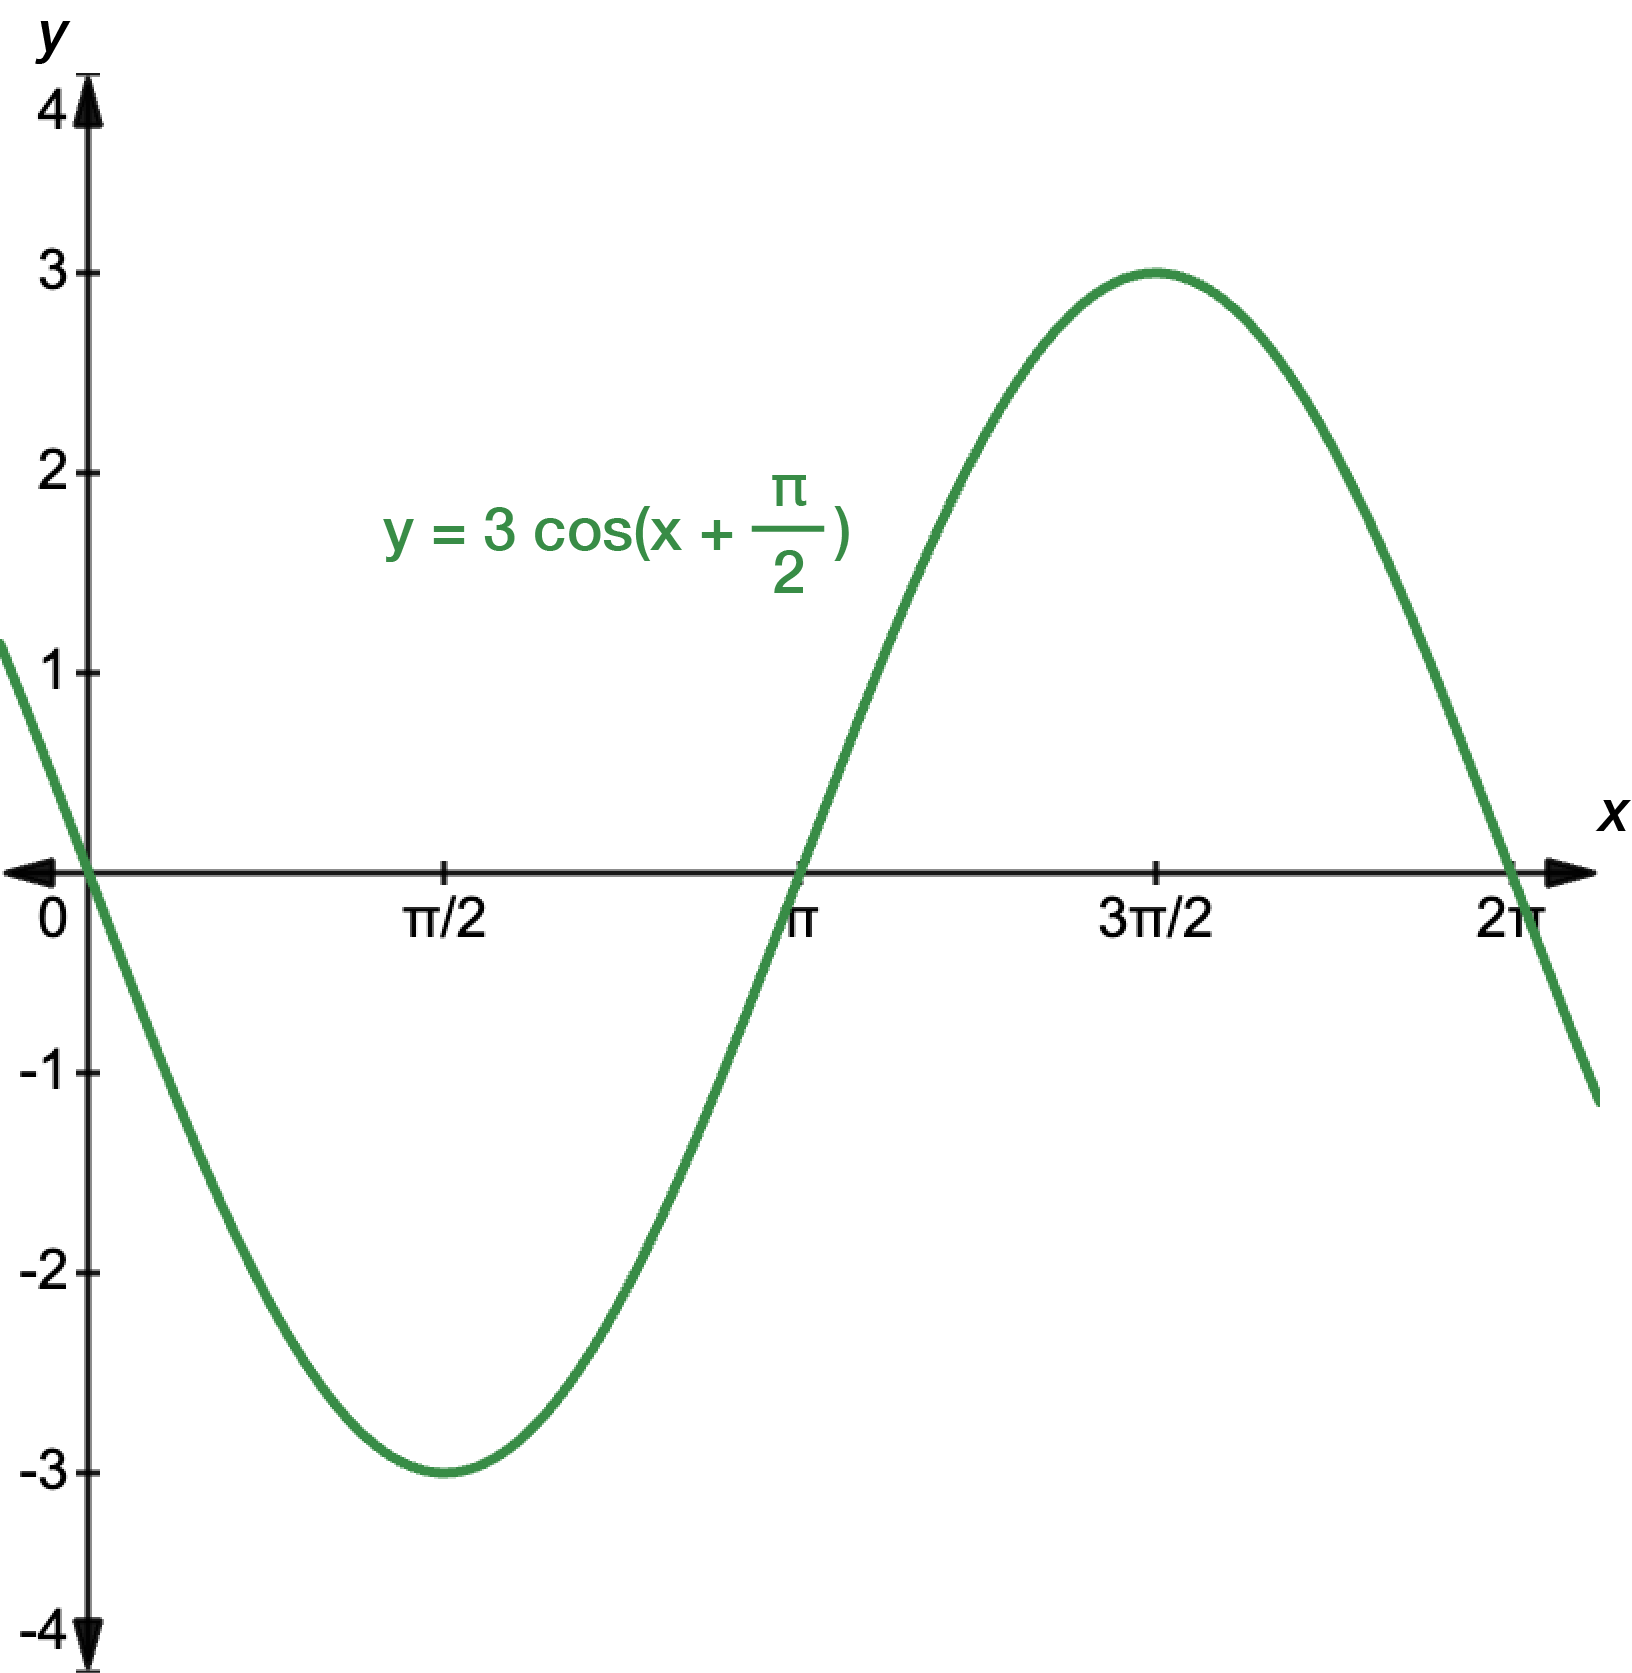
\(y=3\cos\left(x+\dfrac{\pi}{2}\right)\)
Sketch the graphs of the following functions for one complete cycle, and state the amplitude and period.
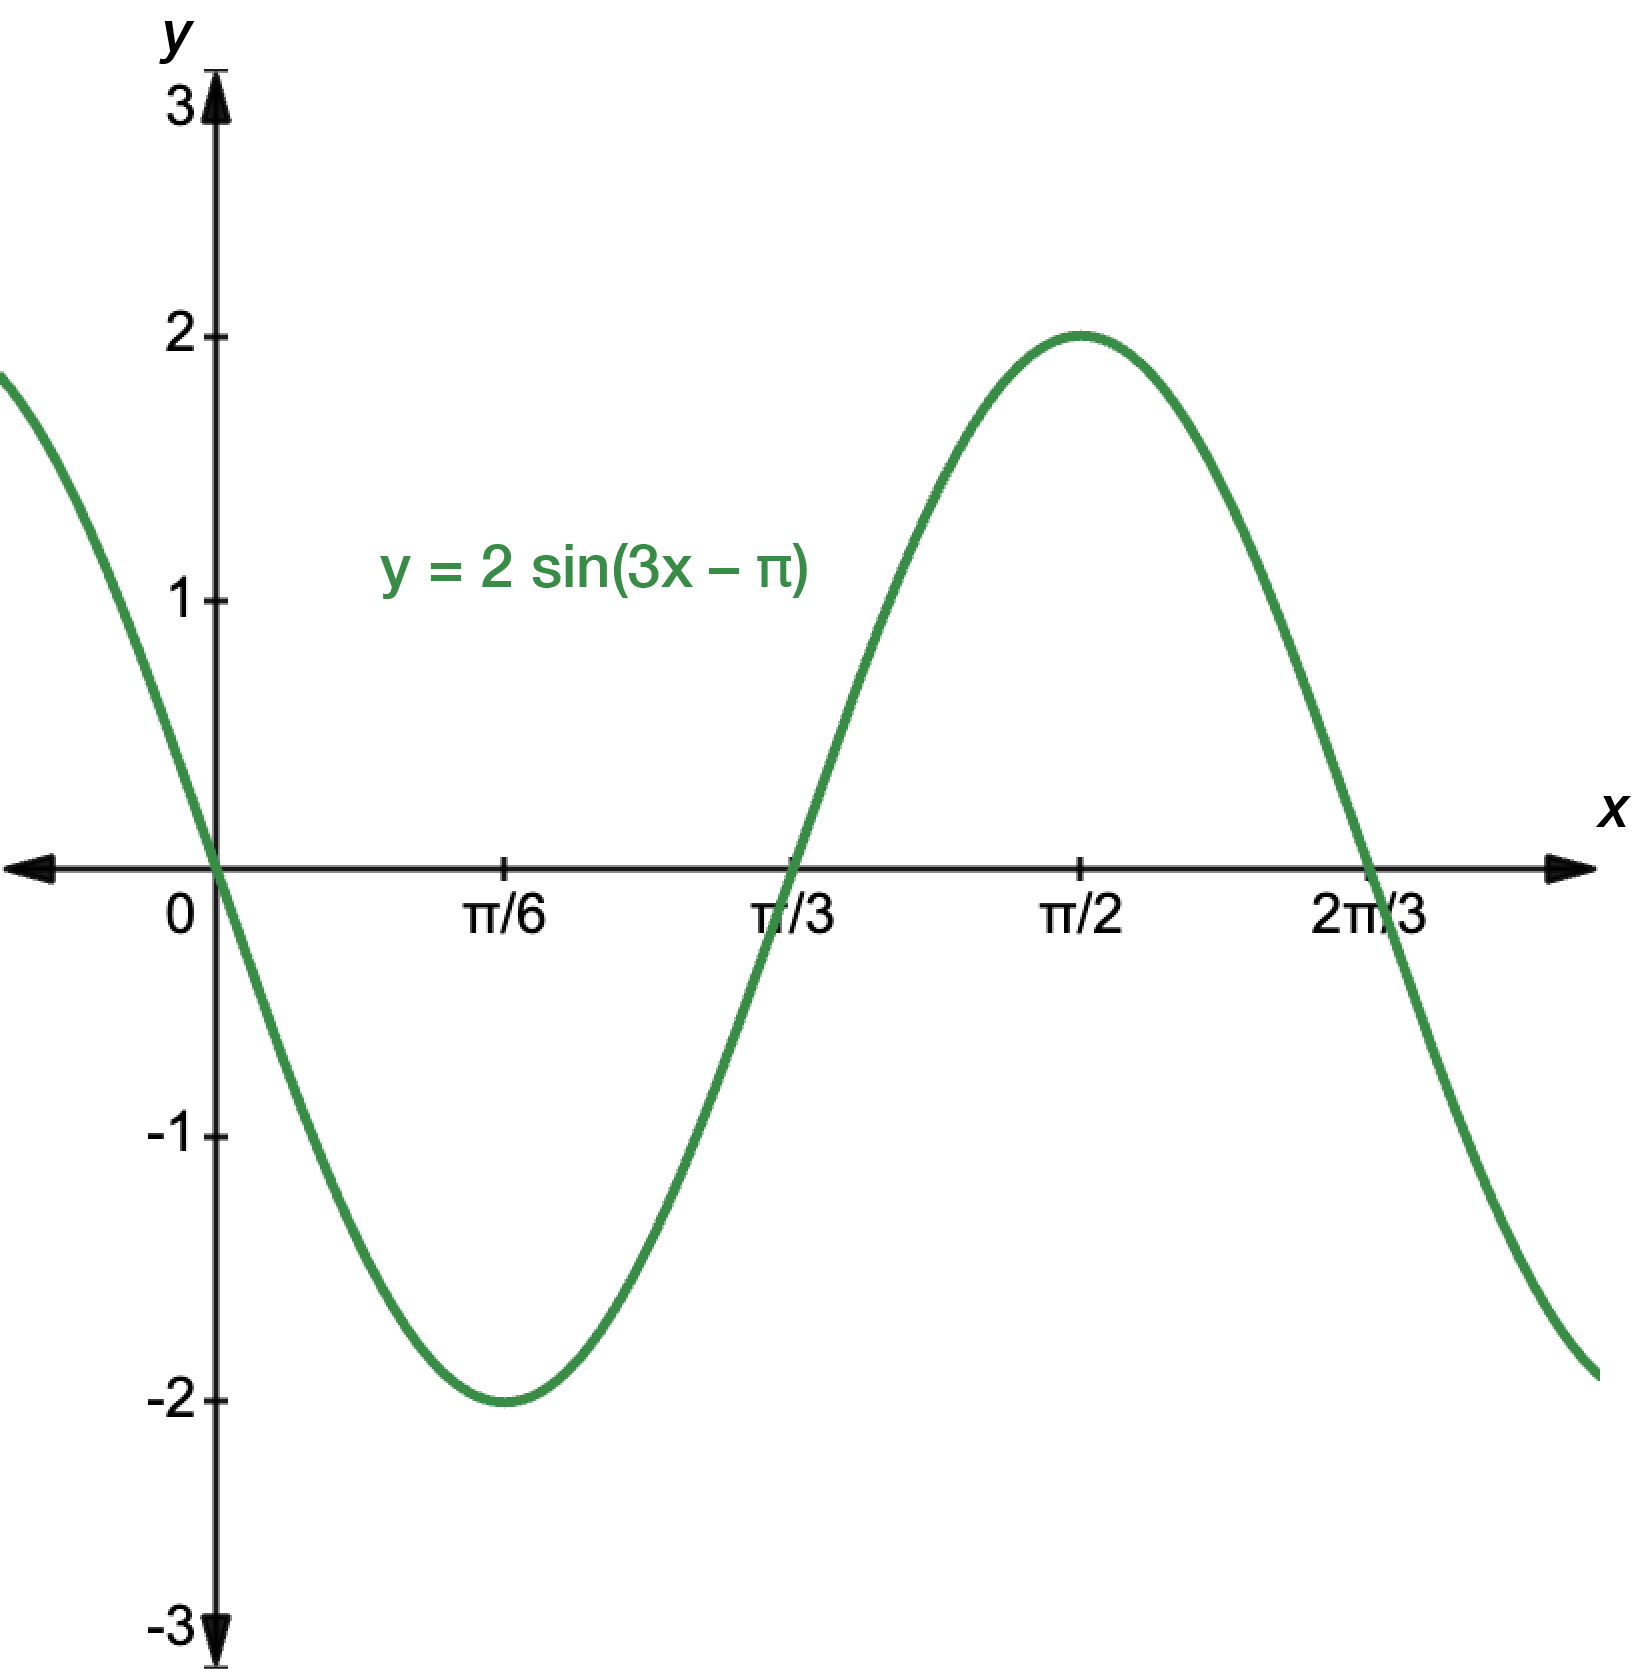
\(y=2\sin(3x-\pi)\)
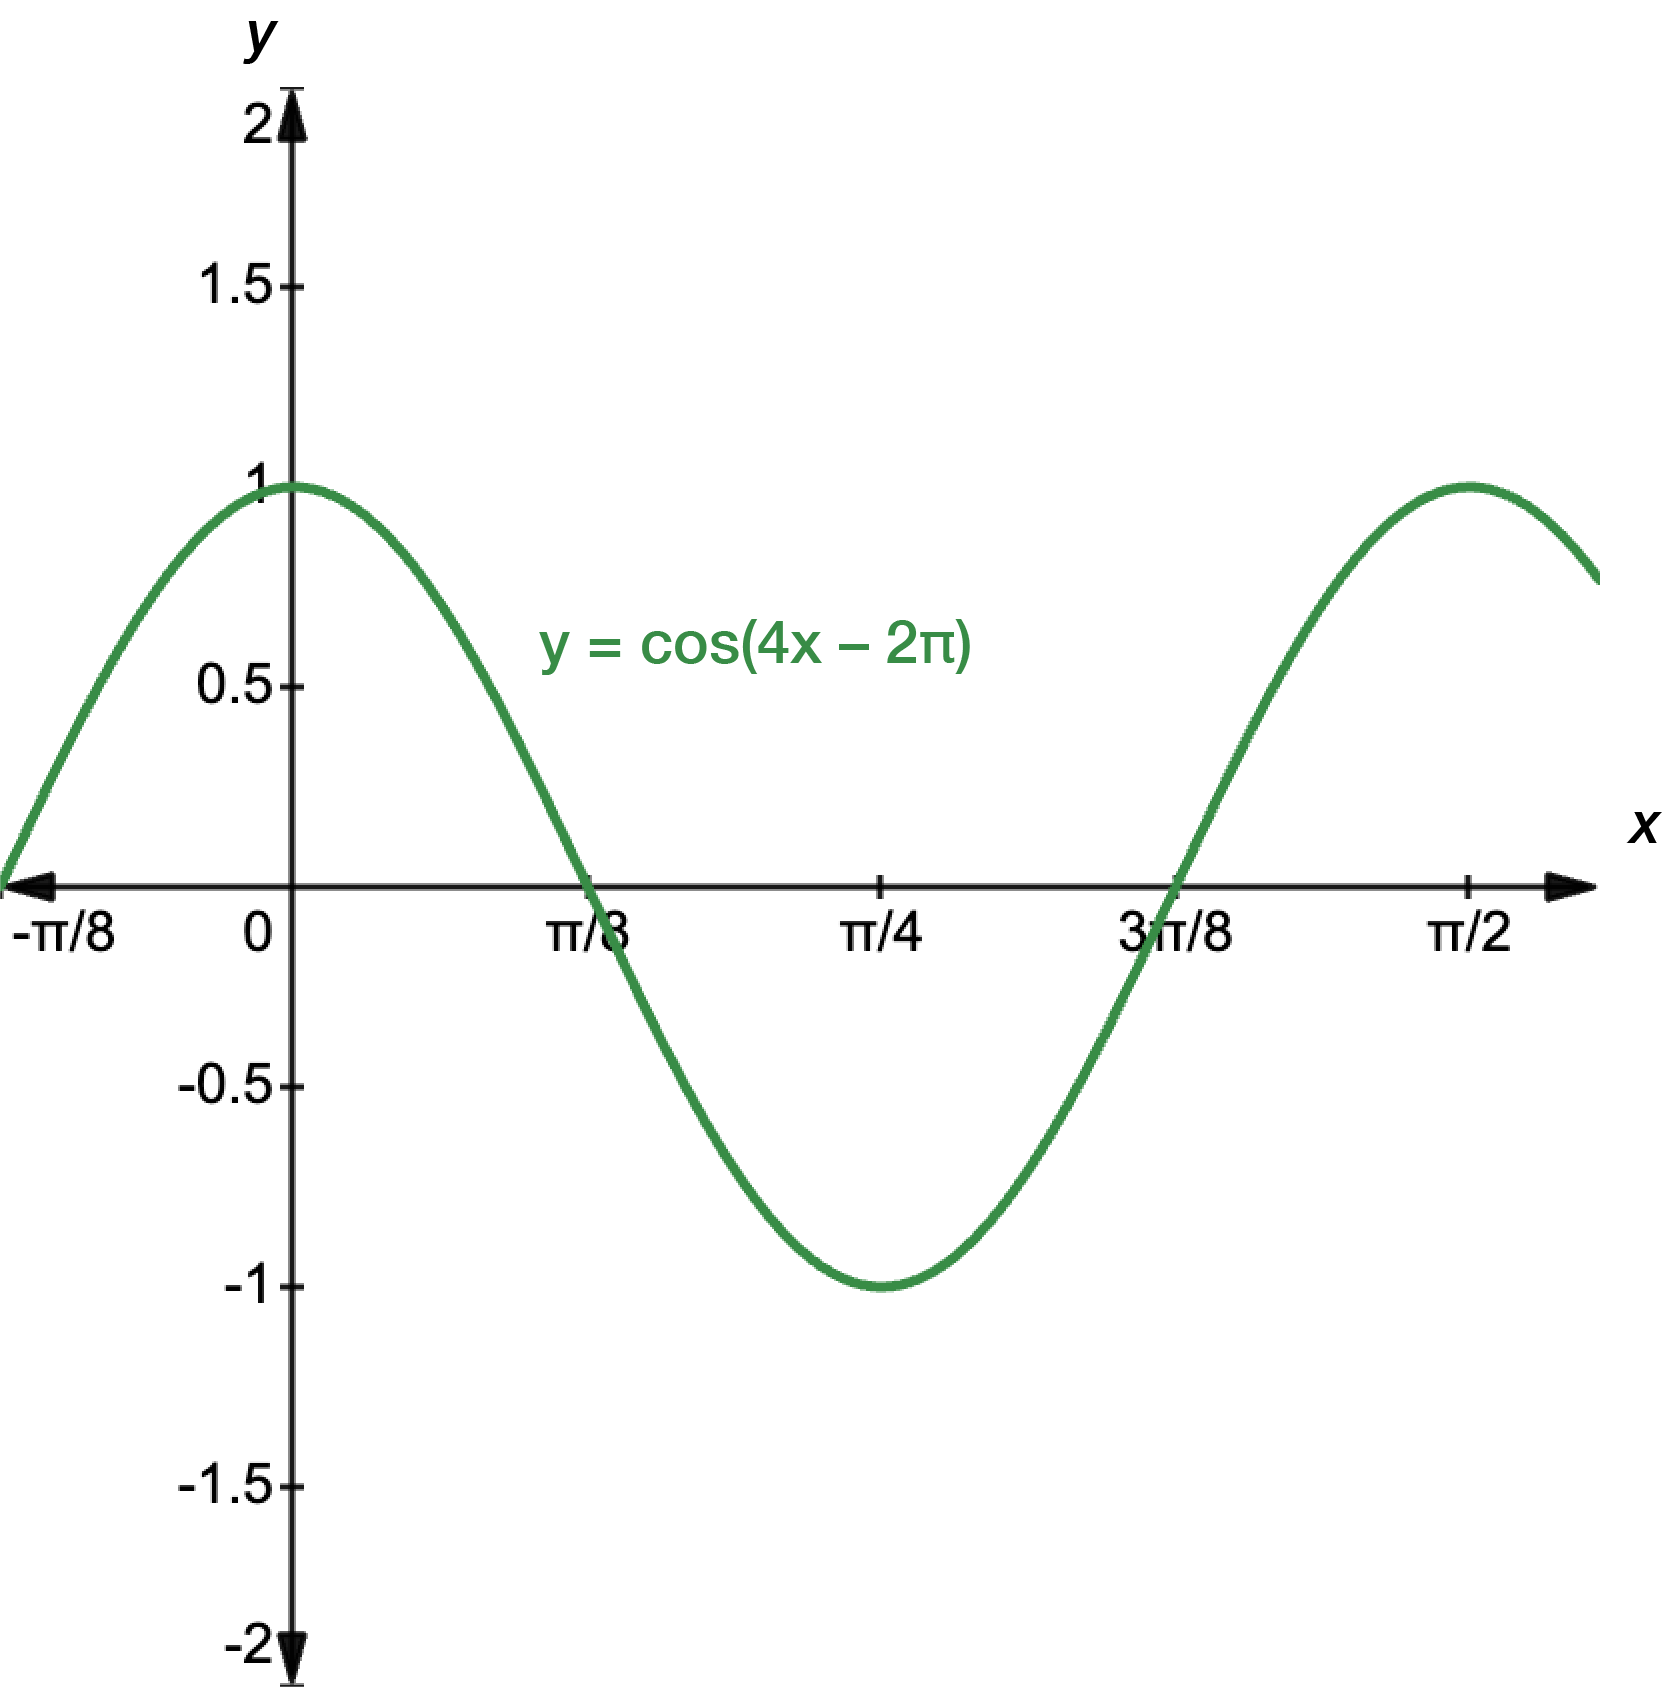
\(y=3\cos(4x-2\pi)\)
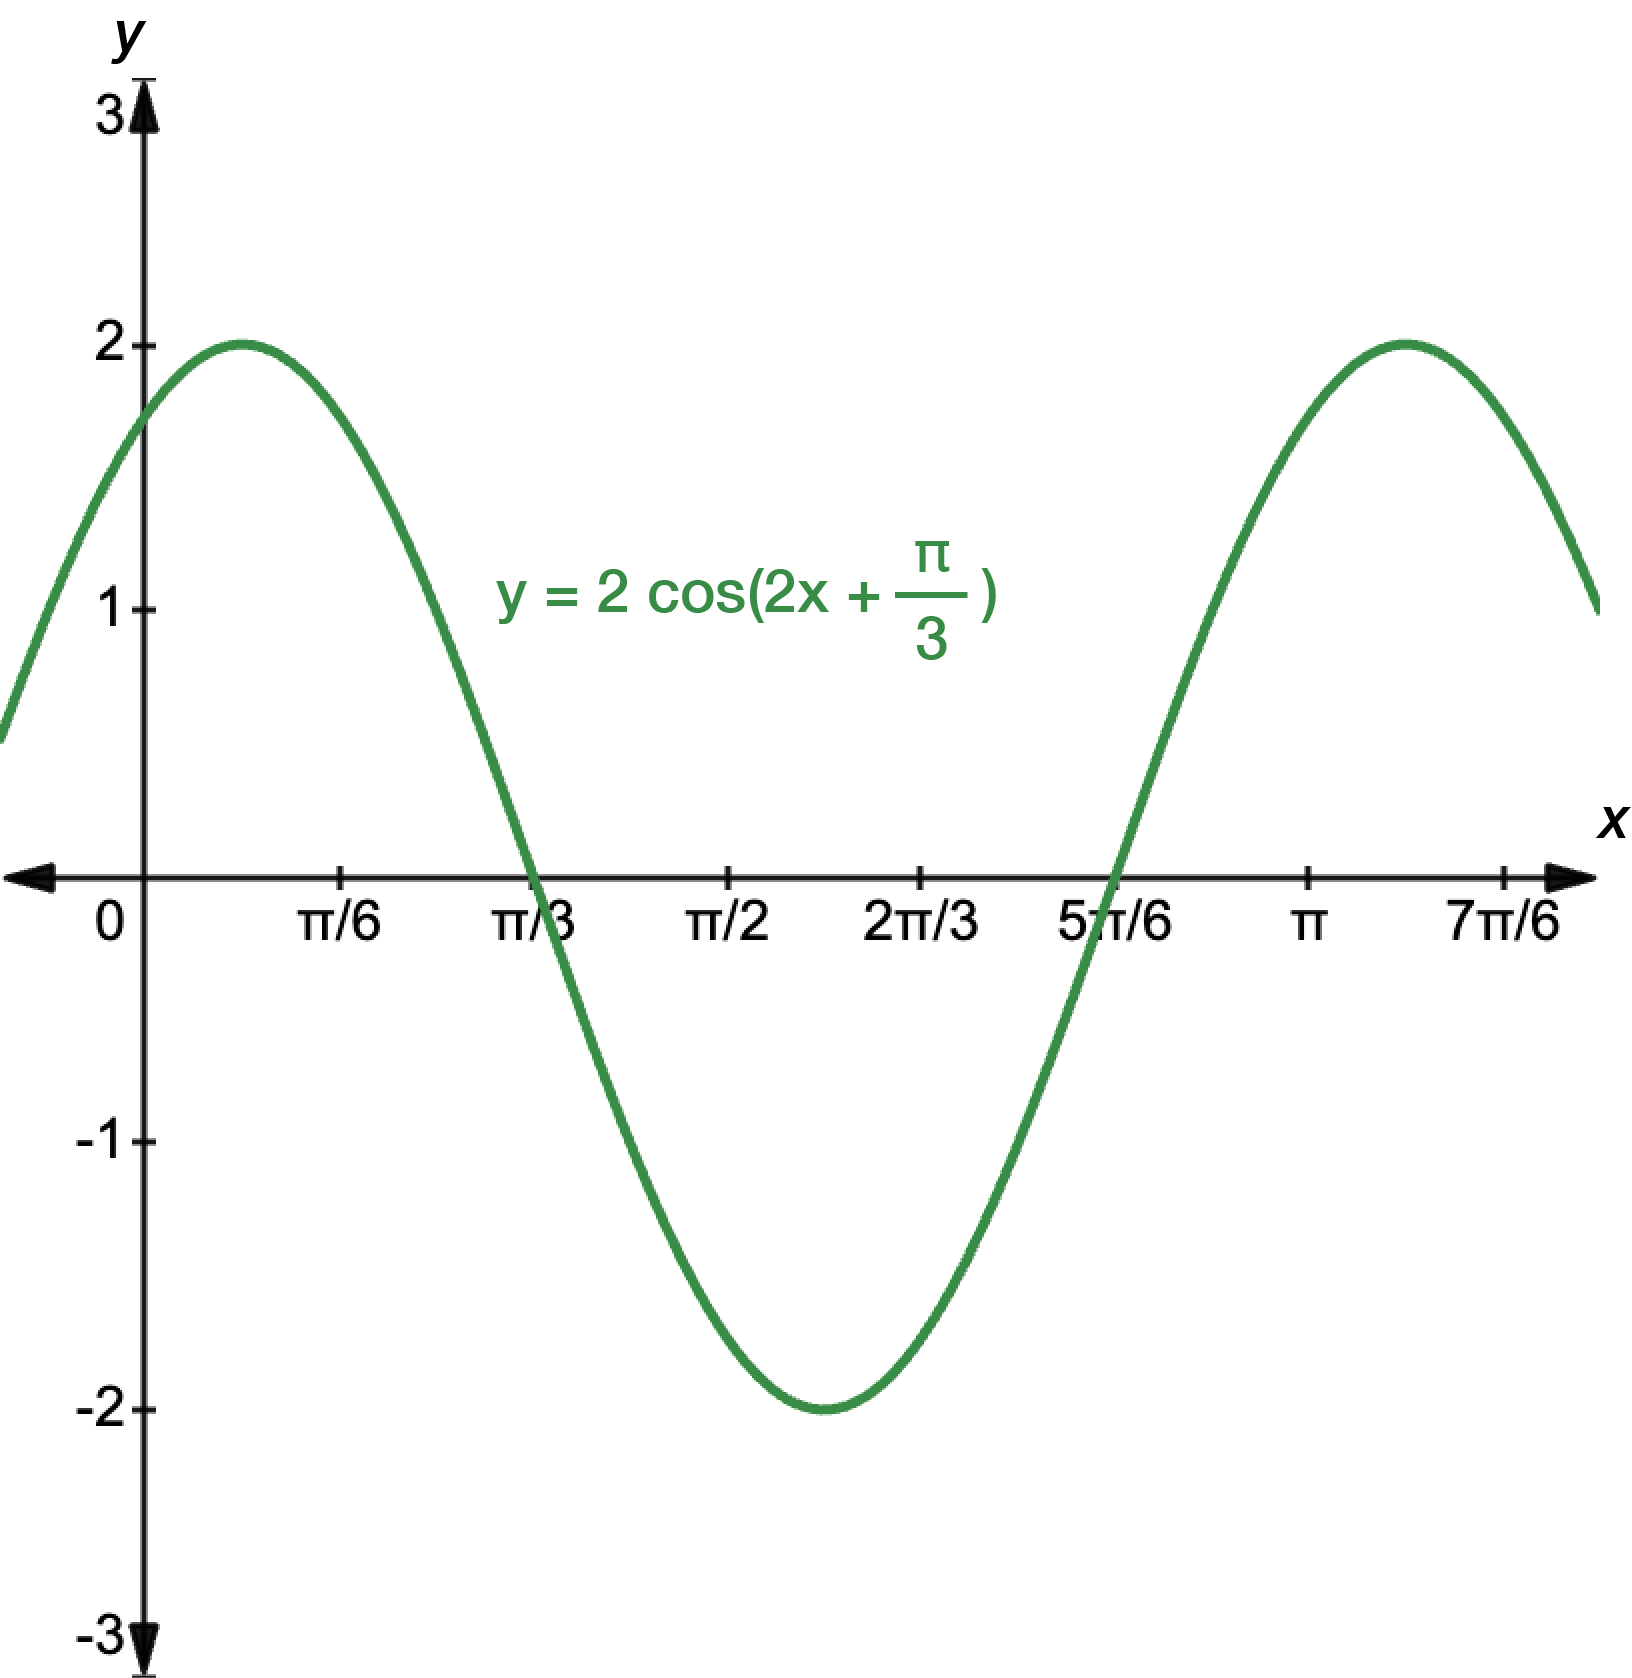
\(y=2\sin\left(2x+\dfrac{\pi}{3}\right)\)
Amplitude = \(2\), period = \(2\pi\)
Amplitude = \(2\), period = \(\dfrac{2\pi}{3}\)
Amplitude = \(\dfrac{1}{2}\), period = \(\pi\)
Amplitude = \(3\), period = \(4\pi\)
Amplitude = \(2\), period = \(\dfrac{2\pi}{3}\)
Amplitude = \(2\), period = \(2\pi\)
Amplitude = \(3\), period = \(2\pi\)
Amplitude = \(2\), period = \(\dfrac{2\pi}{3}\)
Amplitude = \(3\), period = \(\dfrac{\pi}{2}\)
Amplitude = \(2\), period = \(\pi\)
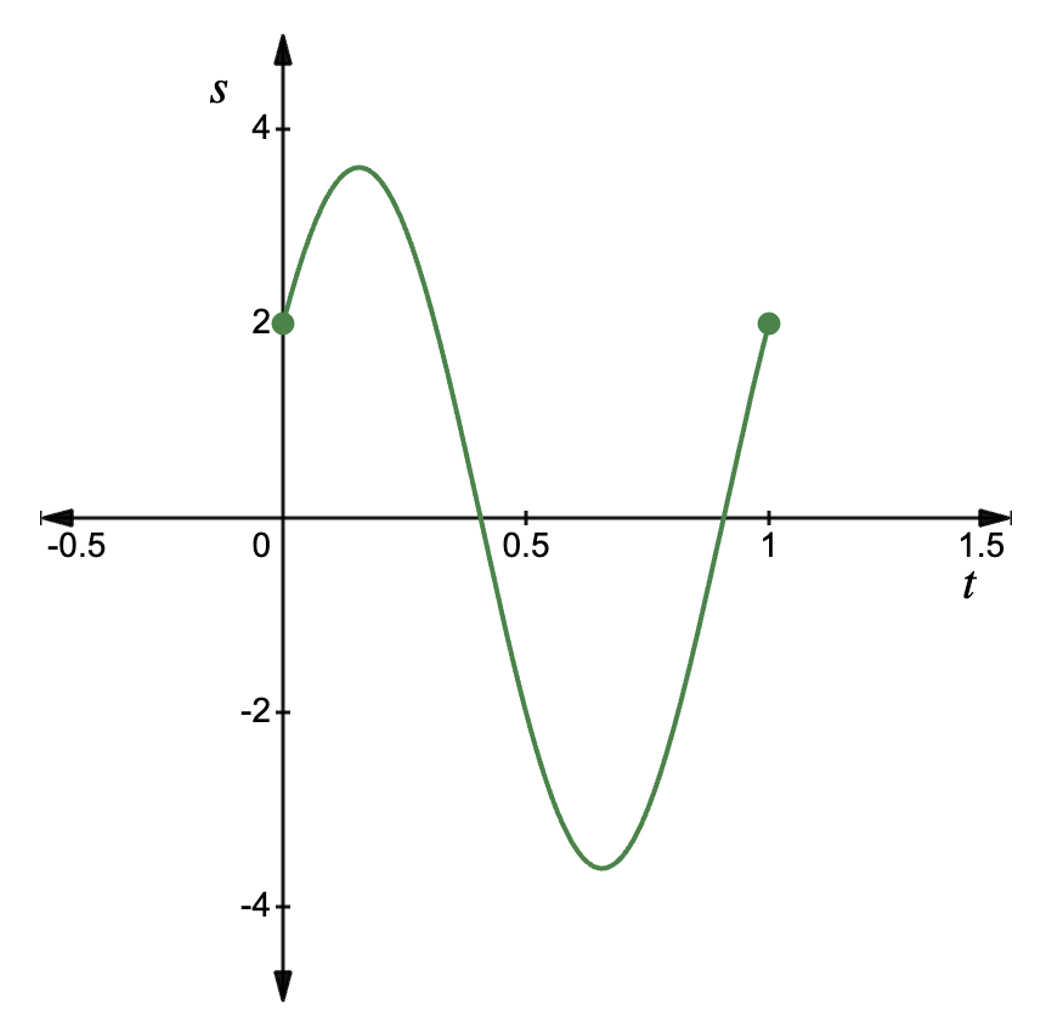
Circular functions in context
In signal processing, an engineer is analysing a sound wave modelled by the function \(s(t)-3\sin(2\pi t)+2\cos(2\pi t)\), where \(t\) represents time in seconds. Graph this function over the interval \(\left[0,\,1\right]\).