BioMan: Enzymatic!
Play the Enzymatic! game to learn about how enzymes work.
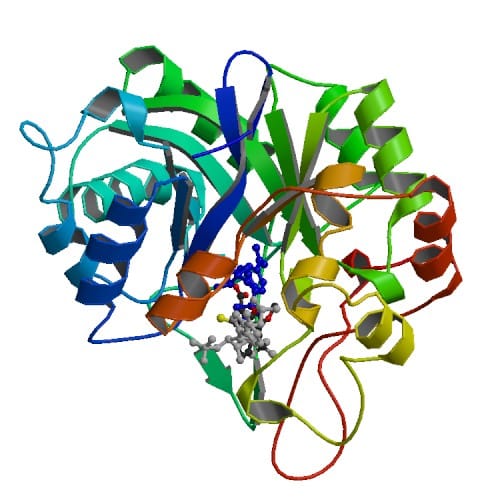
Enzymes are special proteins that are critical in many chemical reactions that occur in living organisms. Knowing how enzymes work is necessary for understanding how metabolic processes are controlled and maintained within cells. This has broader applications in agriculture, medicine and even in textiles. Use this resource to learn about the structure and function of enzymes.
Enzymes are proteins that act as catalysts; they speed up chemical reactions by providing another pathway for the reaction to occur that requires less energy. This makes processes occur more efficiently.
A line graph showing how energy changes as a reaction occurs. There are two lines on the graph: a solid line labelled "Without enzyme" and a dashed line labelled "With enzyme". The x-axis is labelled "Reaction progress" and the y-axis is labelled "Energy". Neither have values, as the graph shows a rough profile of how energy changes. The without enzyme line begins at about two-fifths of the way up the y-axis and continues at this energy level as the reaction progresses, until it increases and reaches a peak close to the maximum value of the y-axis. The energy then decreases gradually until it plateaus at a lower energy than when the reaction started. The with enzyme line looks very similar to the without enzyme one. The only difference is that the peak occurs at the lower energy value.
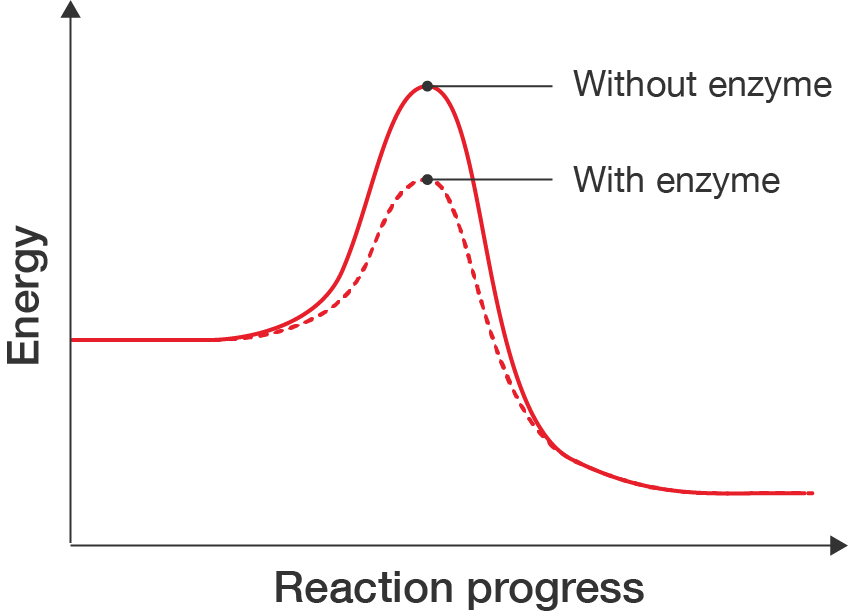
Line graph showing energy changes during a reaction
Enzymes play critical roles in a huge range of cellular functions, like digestion, energy production, protein synthesis and DNA replication. Examples of enzymes include RNA polymerase which catalyses the transcription of DNA into RNA, amylase which breaks down complex sugars from your diet into simple sugars that your body can use, and lactase which catalyses the digestion of lactose found in dairy foods.
Usually, enzymes work by bringing together two or more molecules, called substrates and joining them, or breaking one substrate into multiple products. Their ability to do this depends on their structure. The site where the enzyme binds the substrates, called the active site needs to the correct shape to bind the substrates.
Once the substrates bind to the enzyme, they form an enzyme–substrate complex. The reaction occurs to form an enzyme–products complex, then the products are released and the enzyme is free to catalyse the next reaction. Enzymes are not consumed in catalysis.
Process of Enzyme Catalysis by arloopa on Sketchfab, licensed under Standard Sketchfab License
The function of enzymes is described by two models: the lock-and-key model and the induced fit model.
The lock-and-key model of enzyme action was proposed by German chemist Emil Fisher in 1984. He theorised that the shape of an enzyme’s active site was rigid and specifically matched the shape of its substrates, just like a lock has a unique key.
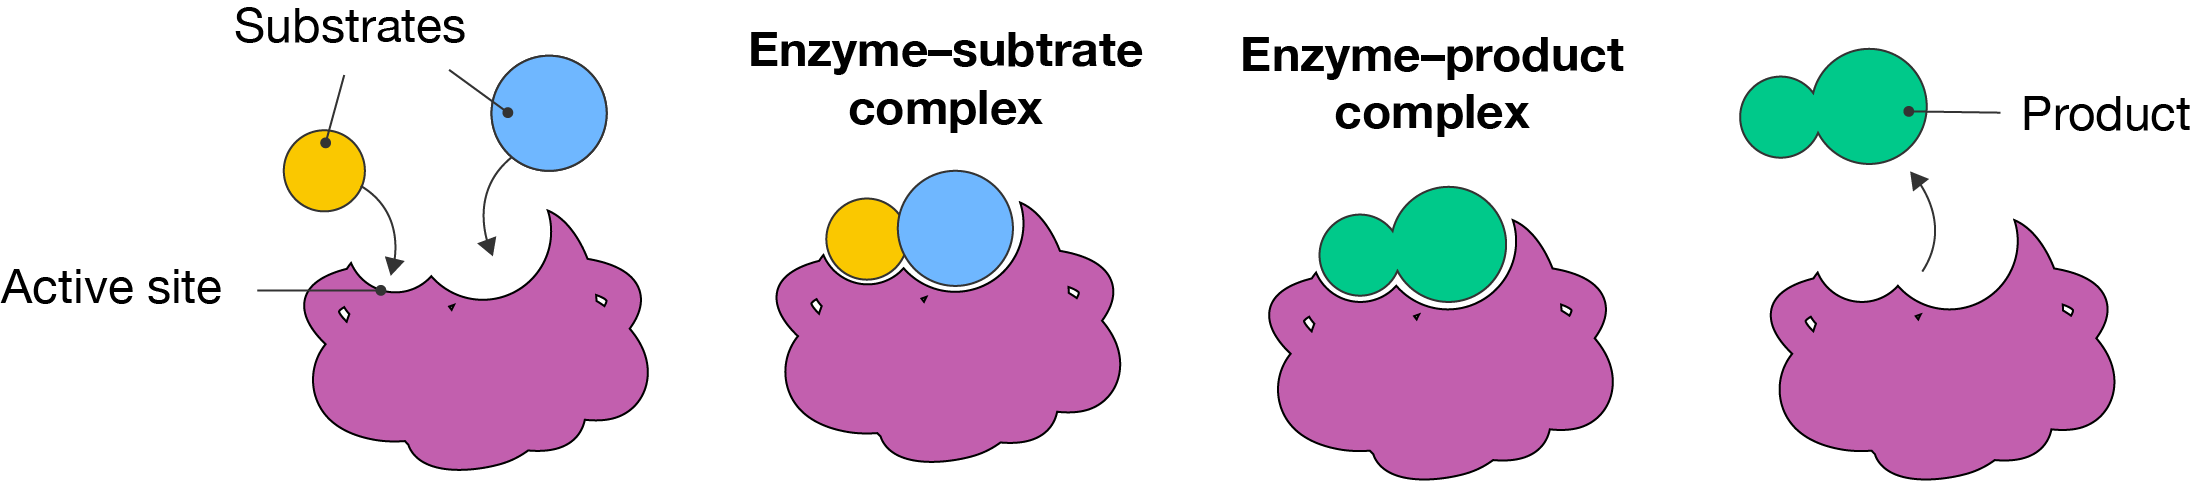
Lock-and-key model of enzyme action
The induced fit model of enzyme action was proposed by American biochemist Daniel E. Koshland in 1958. It is an extension of Fisher’s lock-and-key model, where the enzyme changes shape slightly (or undergoes a conformation change) to bind substrates. This model helped to explain how enzymes can bind more than one type of substrate.
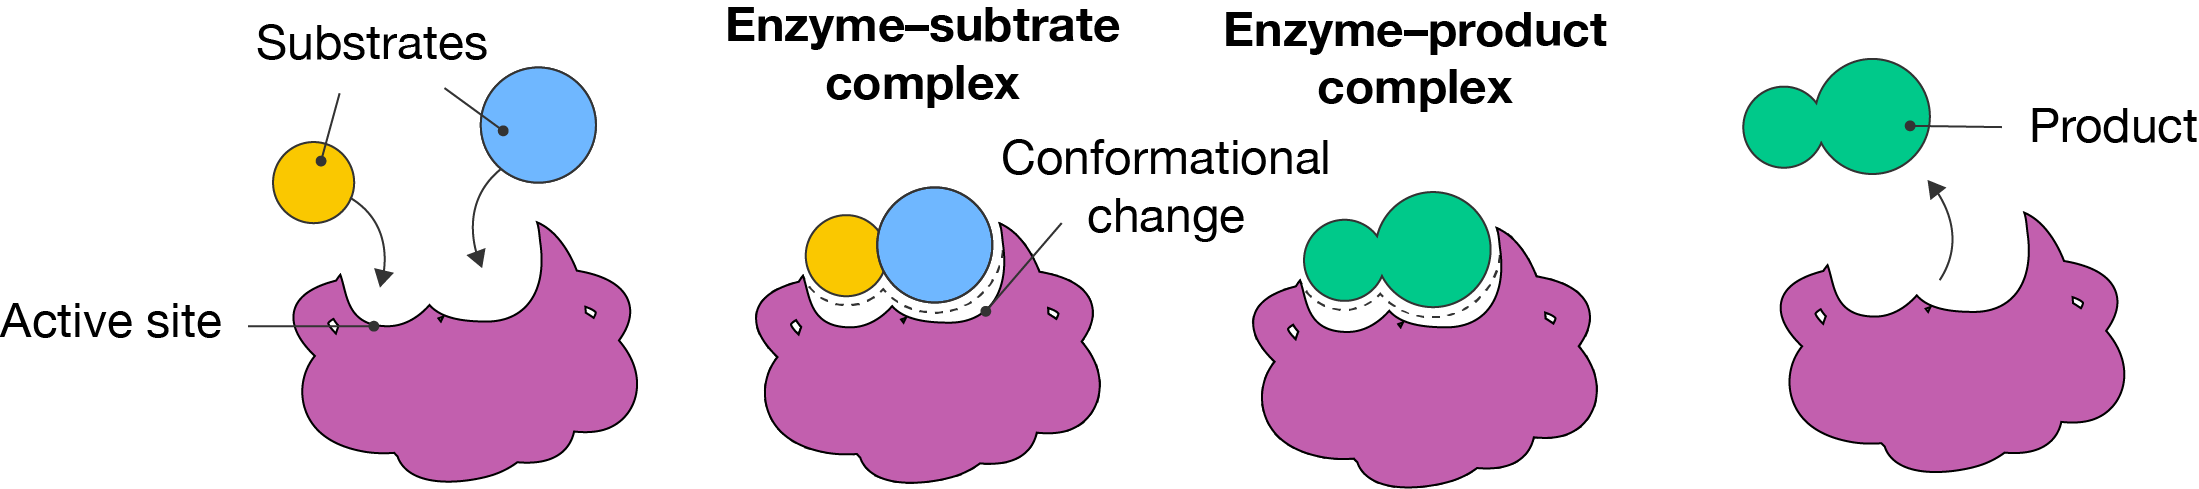
Induced fit model of enzyme action
Several factors can affect enzyme action or activity, which then affects the efficiency of chemical reactions. These include:
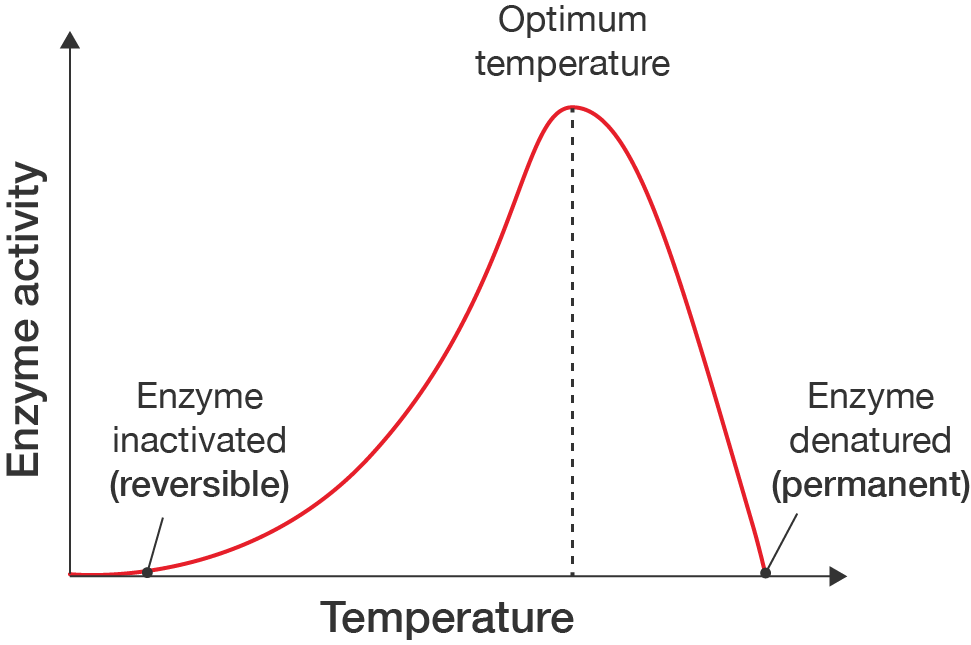
A line graph showing how enzyme action is affected by temperature.
The x-axis is labelled "Temperature" and the y-axis is labelled "Enzyme activity". Neither have values, as the graph shows a rough profile of how enzyme activity is affected.
The line starts at 0, gradually increases to a maximum, then more quickly decreases back down to 0. At the far left end is the label "Enzyme inactivated (reversible)" and at the far right end is the label "Enzyme denatured (permanent)".
The peak of the curve is labelled "Optimum temperature", with a dashed line extending from the line down to the temperature axis.
In some cases, enzymes may rely on their charges to bind with substrates, thus the absence of these charges may affect their ability to perform their function.
A line graph showing how enzyme action is affected by pH. The x-axis is labelled "pH" and the y-axis is labelled "Enzyme activity". Neither have values, as the graph shows a rough profile of how enzyme activity is affected. There are two curves. The red curve extends over the lower pH range and is labelled with "High H+". It increases from no enzyme activity to a maximum, before decreasing back down to 0. The peak of the curve is labelled "Optimum pH for enzyme 1", with a dashed line extending from the line down to the pH axis. The blue curve extends over the higher pH range, and is labelled "Low H+". It has a similar bell shape as the red curve, but is a bit wider. The peak of the curve is labelled "Optimum pH for enzyme 2", with a dashed line extending from the line down to the pH axis.
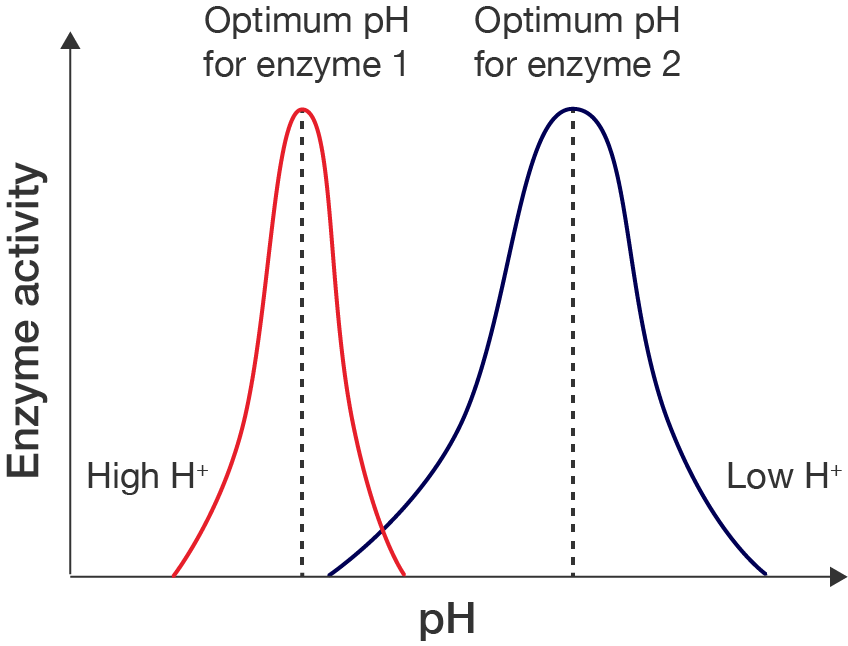
Line graph showing effect of pH on enzyme action
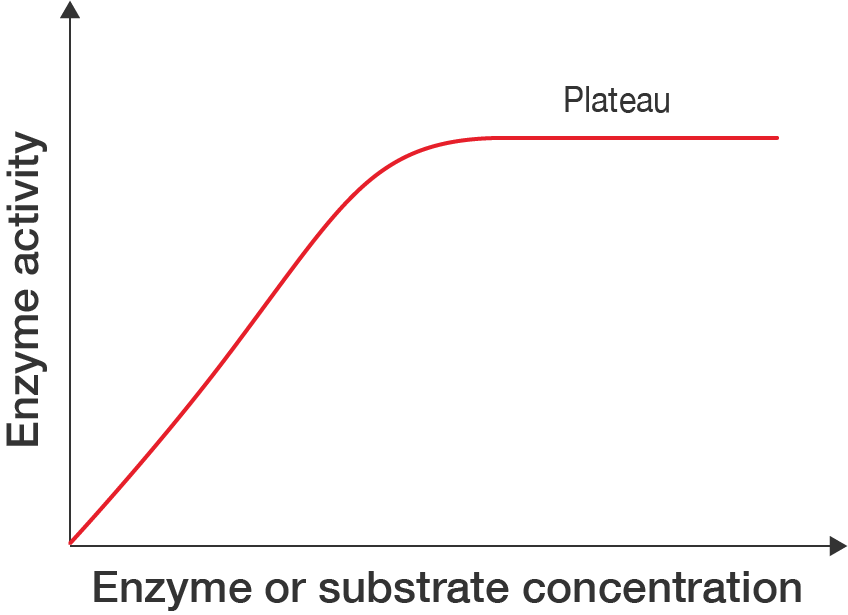
A line graph showing how enzyme action is affected by concentrations of enzyme or substrate.
The x-axis is labelled "Enzyme or substrate concentration" and the y-axis is labelled "Enzyme activity". Neither have values, as the graph shows a rough profile of how enzyme activity is affected.
There is one curve, beginning at 0 and increasing at a steady rate before it plateaus.
There are three types of inhibitors:
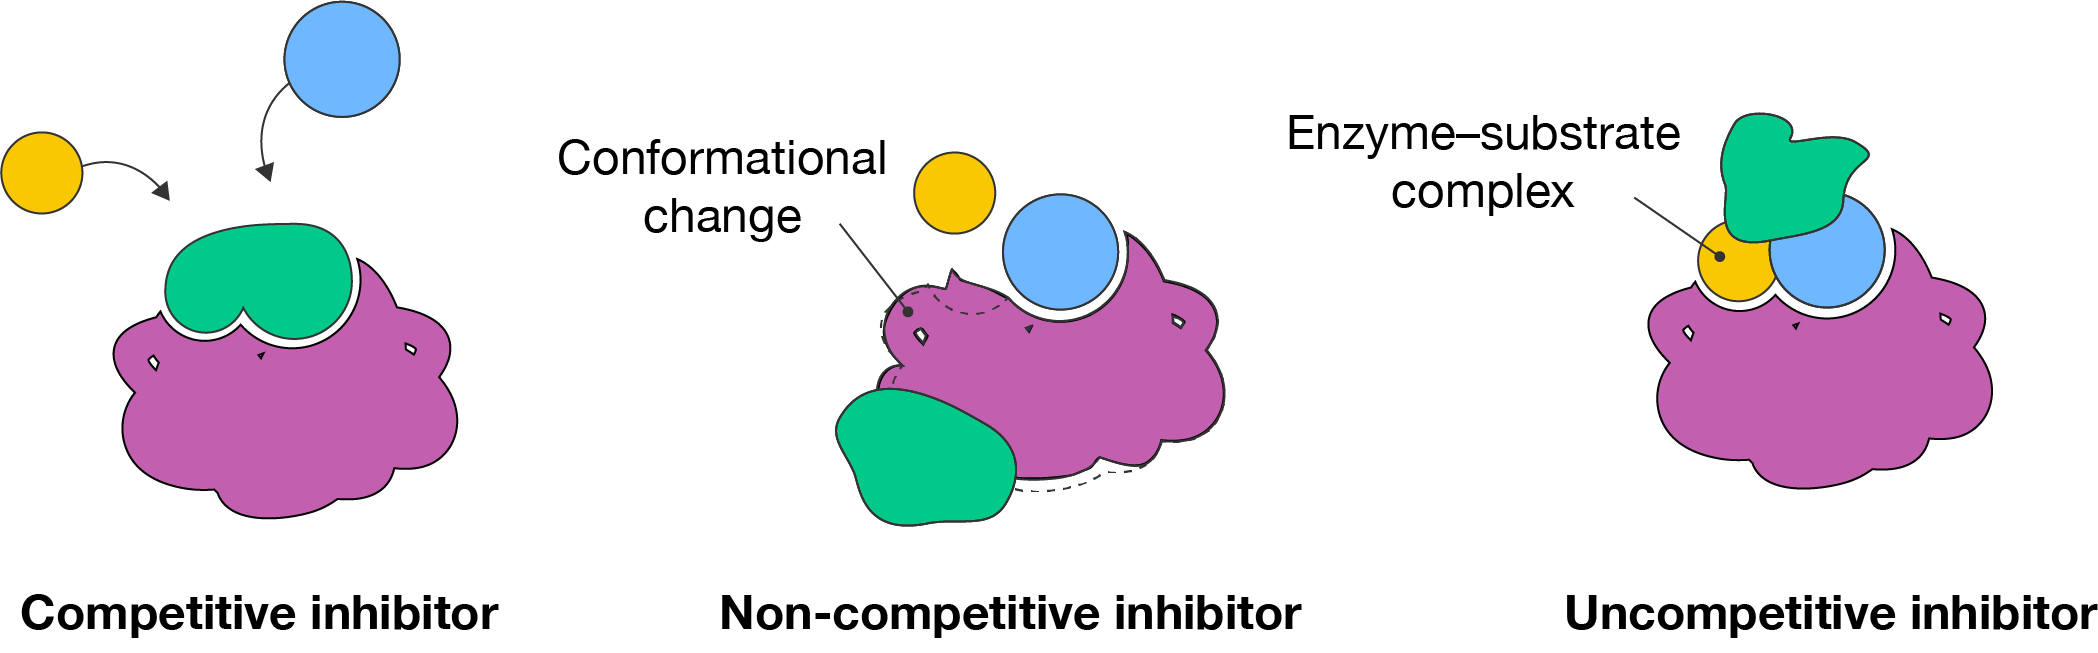
Activators can increase enzyme activity by helping the substrates bind. They might do this by binding to specific sites on the enzyme that help stabilise its structure.
See how well you understand the structure and function of enzymes with a quick quiz.
Read the scenario and use the information provided to answer the questions in the quiz.
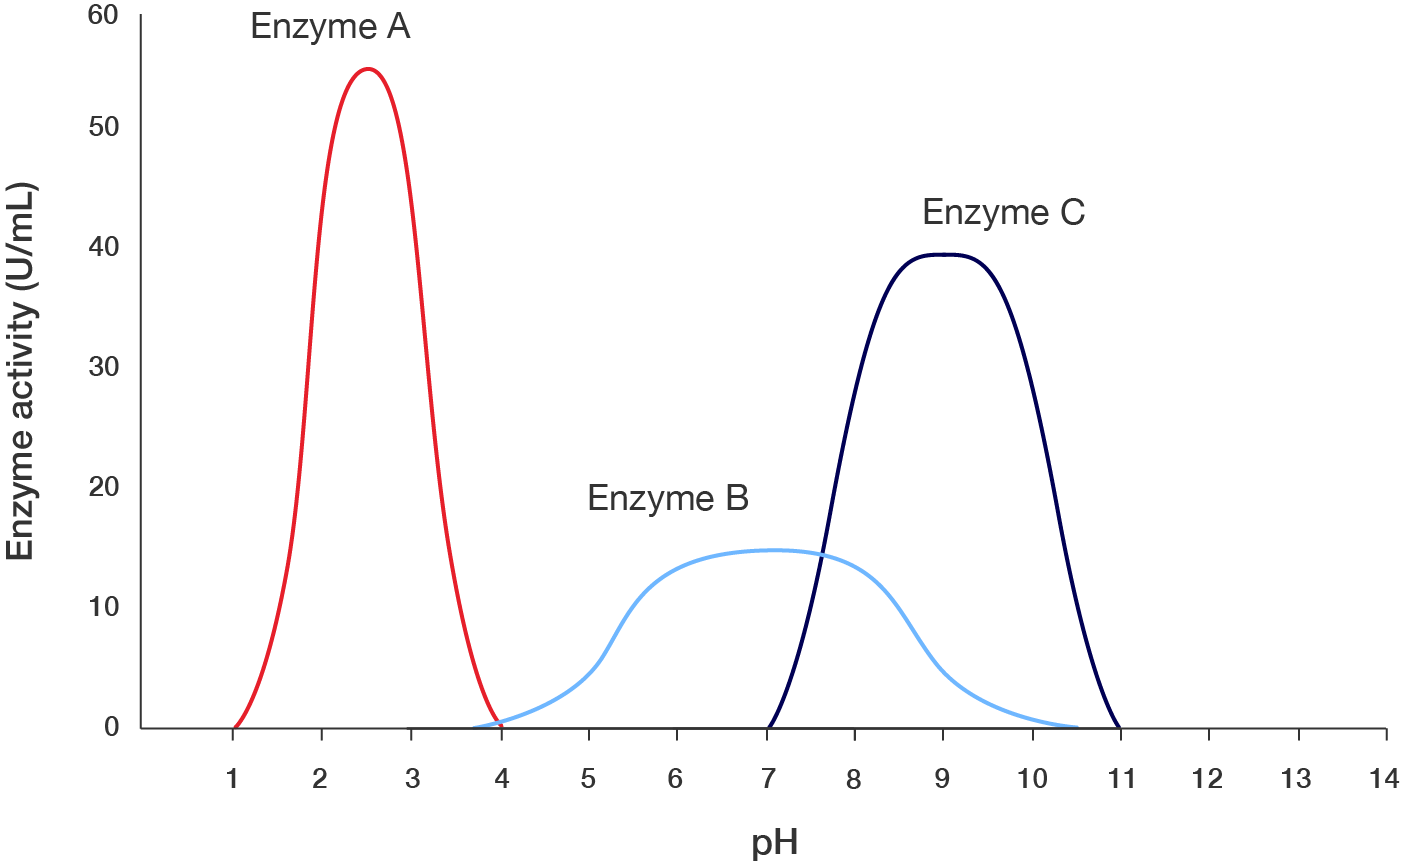
Dr Catherine de List is studying the effect of pH on the activity of three enzymes: enzyme A, B and C. She measures their activity in enzyme units per millilitre over the whole pH spectrum. This is presented in the following graph.
A line graph showing pH affects the action of three enzymes: Enzyme A, Enzyme B and Enzyme C. The x-axis is labelled "pH", starting at 0 and ending at 14, with increments of 14. The y-axis is labelled "Enzyme activity (U/mL)", starting at 0 and ending at 60, with increments of 10. There are three curves, each representing one enzyme.
Line graph showing effect of pH on enzyme action
Images on this page by RMIT, licensed under CC BY-NC 4.0


RMIT University acknowledges the people of the Woi wurrung and Boon wurrung language groups of the eastern Kulin Nation on whose unceded lands we conduct the business of the University. RMIT University respectfully acknowledges their Ancestors and Elders, past and present. RMIT also acknowledges the Traditional Custodians and their Ancestors of the lands and waters across Australia where we conduct our business - Artwork 'Sentient' by Hollie Johnson, Gunaikurnai and Monero Ngarigo.
More information