Introduction
A network diagram is also known as a PERT Program Evaluation and Review Technique is a project management tool which is used to schedule tasks within a project. A PERT chart considers the relationships between tasks and assists in sequencing tasks which are dependent on others. A PERT chart may be drawn by hand or by computer using a software package such as Microsoft Project. Chart (Program Evaluation and Review Technique). PERT charts were developed in the 1950s under contract to the United States Department of Defence. They are used to organise and coordinate tasks within a project and can be done by hand or by using a software package such as Microsoft Project.
There are two different ways these diagrams can be presented.
Method 1: Activity on the node
In this diagram the activities are written inside the boxes and are linked by arrows. These arrows may or may not have the number of days to complete the task written on them.
Method 2: Activity on the arrow
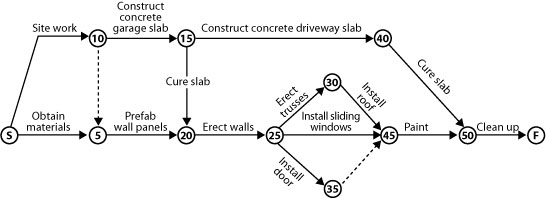
In this diagram the actual activities to be carried out are written on the arrows. The activities are set out numerically which allows for sub-events to happen in between. Gaps are left between the numbers in the nodes (circles) to allow the sub-events to fit in. On large building sites these numbers may count in 20s or 50s or even 100s, whilst on smaller jobs these could be actual days within the construction program.
The more common method in use is method 2 - activity on the arrow. Each of the numbered nodes (the circles) represents an activity which has been completed while each arrow represents an activity that has taken place.